Search for Indicators
Access to Health Services
Indicator Gauge Icon Legend
Legend Colors
Red is bad, green is good, blue is not statistically different/neutral.
Compared to Distribution
 the value is in the best half of communities.
 the value is in the 2nd worst quarter of communities.
 the value is in the worst quarter of communities.
Compared to Target
 meets target;
  does not meet target.
Compared to a Single Value
 lower than the comparison value;
 higher than the comparison value;
 not statistically different from comparison value.
Trend

 non-significant change over time;
 significant change over time;
  no change over time.
Compared to Prior Value
 higher than the previous measurement period;
 lower than the previous measurement period;
 no statistically different change from previous measurement period.
Health / Health Care Access & Quality
Health / Health Care Access & Quality
Adults Delayed or had Difficulty Obtaining Care
Value
Compared to:
Adults Delayed or had Difficulty Obtaining Care County: Lake
Adults Delayed or had Difficulty Obtaining Care County: Lake
25.7%
(2019-2020)
Compared to:


CA Value
(22.0%)
The regional value is compared to the California state value.
Prior Value
(23.8%)
Prior Value compares a measured value with the previously measured value. Confidence intervals were taken into account in determining the direction of the comparison.
Trend
This comparison measures the indicator’s values over multiple time periods.<br>The Mann-Kendall Test for Statistical Significance is used to evaluate the trend<br>over 4 to 10 periods of measure, subject to data availability and comparability.
Adults Delayed or had Difficulty Obtaining Care Zip Code: 95422
Adults Delayed or had Difficulty Obtaining Care Zip Code: 95422
28.9%
(2019-2020)
Compared to:

Lake, CA County Value
(25.7%)
The regional value is compared to the Lake County value.
Prior Value
(26.8%)
Prior Value compares a measured value with the previously measured value. Confidence intervals were taken into account in determining the direction of the comparison.
Trend
This comparison measures the indicator’s values over multiple time periods.<br>The Mann-Kendall Test for Statistical Significance is used to evaluate the trend<br>over 4 to 10 periods of measure, subject to data availability and comparability.
Adults Delayed or had Difficulty Obtaining Care Zip Code: 95423
Adults Delayed or had Difficulty Obtaining Care Zip Code: 95423
25.7%
(2019-2020)
Compared to:
Lake, CA County Value
(25.7%)
The regional value is compared to the Lake County value.
Prior Value
(28.5%)
Prior Value compares a measured value with the previously measured value. Confidence intervals were taken into account in determining the direction of the comparison.
Trend
This comparison measures the indicator’s values over multiple time periods.<br>The Mann-Kendall Test for Statistical Significance is used to evaluate the trend<br>over 4 to 10 periods of measure, subject to data availability and comparability.
Adults Delayed or had Difficulty Obtaining Care Zip Code: 95426
Adults Delayed or had Difficulty Obtaining Care Zip Code: 95426
28.4%
(2019-2020)
Compared to:
Lake, CA County Value
(25.7%)
The regional value is compared to the Lake County value.
Prior Value
(30.7%)
Prior Value compares a measured value with the previously measured value. Confidence intervals were taken into account in determining the direction of the comparison.
Trend
This comparison measures the indicator’s values over multiple time periods.<br>The Mann-Kendall Test for Statistical Significance is used to evaluate the trend<br>over 4 to 10 periods of measure, subject to data availability and comparability.
Adults Delayed or had Difficulty Obtaining Care Zip Code: 95451
Adults Delayed or had Difficulty Obtaining Care Zip Code: 95451
24.4%
(2019-2020)
Compared to:
Lake, CA County Value
(25.7%)
The regional value is compared to the Lake County value.
Prior Value
(27.8%)
Prior Value compares a measured value with the previously measured value. Confidence intervals were taken into account in determining the direction of the comparison.
Trend
This comparison measures the indicator’s values over multiple time periods.<br>The Mann-Kendall Test for Statistical Significance is used to evaluate the trend<br>over 4 to 10 periods of measure, subject to data availability and comparability.
Adults Delayed or had Difficulty Obtaining Care Zip Code: 95453
Adults Delayed or had Difficulty Obtaining Care Zip Code: 95453
23.8%
(2019-2020)
Compared to:
Lake, CA County Value
(25.7%)
The regional value is compared to the Lake County value.
Prior Value
(26.8%)
Prior Value compares a measured value with the previously measured value. Confidence intervals were taken into account in determining the direction of the comparison.
Trend
This comparison measures the indicator’s values over multiple time periods.<br>The Mann-Kendall Test for Statistical Significance is used to evaluate the trend<br>over 4 to 10 periods of measure, subject to data availability and comparability.
Adults Delayed or had Difficulty Obtaining Care Zip Code: 95457
Adults Delayed or had Difficulty Obtaining Care Zip Code: 95457
24.7%
(2019-2020)
Compared to:
Lake, CA County Value
(25.7%)
The regional value is compared to the Lake County value.
Prior Value
(28.7%)
Prior Value compares a measured value with the previously measured value. Confidence intervals were taken into account in determining the direction of the comparison.
Trend
This comparison measures the indicator’s values over multiple time periods.<br>The Mann-Kendall Test for Statistical Significance is used to evaluate the trend<br>over 4 to 10 periods of measure, subject to data availability and comparability.
Adults Delayed or had Difficulty Obtaining Care Zip Code: 95461
Adults Delayed or had Difficulty Obtaining Care Zip Code: 95461
25.0%
(2019-2020)
Compared to:
Lake, CA County Value
(25.7%)
The regional value is compared to the Lake County value.
Prior Value
(29.5%)
Prior Value compares a measured value with the previously measured value. Confidence intervals were taken into account in determining the direction of the comparison.
Trend
This comparison measures the indicator’s values over multiple time periods.<br>The Mann-Kendall Test for Statistical Significance is used to evaluate the trend<br>over 4 to 10 periods of measure, subject to data availability and comparability.
Adults Delayed or had Difficulty Obtaining Care Zip Code: 95464
Adults Delayed or had Difficulty Obtaining Care Zip Code: 95464
26.1%
(2019-2020)
Compared to:
Lake, CA County Value
(25.7%)
The regional value is compared to the Lake County value.
Prior Value
(29.1%)
Prior Value compares a measured value with the previously measured value. Confidence intervals were taken into account in determining the direction of the comparison.
Trend
This comparison measures the indicator’s values over multiple time periods.<br>The Mann-Kendall Test for Statistical Significance is used to evaluate the trend<br>over 4 to 10 periods of measure, subject to data availability and comparability.
Adults Delayed or had Difficulty Obtaining Care Zip Code: 95467
Adults Delayed or had Difficulty Obtaining Care Zip Code: 95467
22.6%
(2019-2020)
Compared to:
Lake, CA County Value
(25.7%)
The regional value is compared to the Lake County value.
Prior Value
(27.1%)
Prior Value compares a measured value with the previously measured value. Confidence intervals were taken into account in determining the direction of the comparison.
Trend
This comparison measures the indicator’s values over multiple time periods.<br>The Mann-Kendall Test for Statistical Significance is used to evaluate the trend<br>over 4 to 10 periods of measure, subject to data availability and comparability.
Adults Delayed or had Difficulty Obtaining Care Zip Code: 95485
Adults Delayed or had Difficulty Obtaining Care Zip Code: 95485
24.8%
(2019-2020)
Compared to:
Lake, CA County Value
(25.7%)
The regional value is compared to the Lake County value.
Prior Value
(29.3%)
Prior Value compares a measured value with the previously measured value. Confidence intervals were taken into account in determining the direction of the comparison.
Trend
This comparison measures the indicator’s values over multiple time periods.<br>The Mann-Kendall Test for Statistical Significance is used to evaluate the trend<br>over 4 to 10 periods of measure, subject to data availability and comparability.
Adults Delayed or had Difficulty Obtaining Care Zip Code: 95493
Adults Delayed or had Difficulty Obtaining Care Zip Code: 95493
24.2%
(2019-2020)
Compared to:
Lake, CA County Value
(25.7%)
The regional value is compared to the Lake County value.
Prior Value
(28.5%)
Prior Value compares a measured value with the previously measured value. Confidence intervals were taken into account in determining the direction of the comparison.
Trend
This comparison measures the indicator’s values over multiple time periods.<br>The Mann-Kendall Test for Statistical Significance is used to evaluate the trend<br>over 4 to 10 periods of measure, subject to data availability and comparability.
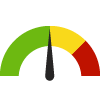
Children with Health Insurance County: Lake
Children with Health Insurance County: Lake
93.6%
(2022)
Compared to:


CA Counties
The distribution is based on data from 42 California counties.
U.S. Counties
The distribution is based on data from 828 U.S. counties and county equivalents.
CA Value
(96.8%)
The regional value is compared to the California state value.
US Value
(94.9%)
The regional value is compared to the national value.
Prior Value
(98.6%)
Prior Value compares a measured value with the previously measured value. Confidence intervals were taken into account in determining the direction of the comparison.
Trend
This comparison measures the indicator’s values over multiple time periods.<br>The Mann-Kendall Test for Statistical Significance is used to evaluate the trend<br>over 4 to 10 periods of measure, subject to data availability and comparability.
Medicare Healthcare Costs County: Lake
Medicare Healthcare Costs County: Lake
$8,632
Dollars per enrollee
(2015)
Compared to:


CA Value
($9,100)
The regional value is compared to the California state value.
US Value
($9,729)
The regional value is compared to the national value.
Prior Value
($8,176)
Prior Value compares a measured value with the previously measured value. Confidence intervals were not taken into account in determining the direction of the comparison.
Trend
This comparison measures the indicator’s values over multiple time periods.<br>The Mann-Kendall Test for Statistical Significance is used to evaluate the trend<br>over 4 to 10 periods of measure, subject to data availability and comparability.
Health / Health Care Access & Quality
People Delayed or had Difficulty Obtaining Care
Value
Compared to:
People Delayed or had Difficulty Obtaining Care County: Lake
People Delayed or had Difficulty Obtaining Care County: Lake
23.4%
(2021-2022)
Compared to:
CA Counties
The distribution is based on data from 58 California counties.
CA Value
(16.5%)
The regional value is compared to the California state value.
Prior Value
(23.4%)
Prior Value compares a measured value with the previously measured value. Confidence intervals were taken into account in determining the direction of the comparison.
Trend
This comparison measures the indicator’s values over multiple time periods.<br>The Mann-Kendall Test for Statistical Significance is used to evaluate the trend<br>over 4 to 10 periods of measure, subject to data availability and comparability.
HP 2030 Target
(5.9%)
People with a Usual Source of Health Care County: Lake
People with a Usual Source of Health Care County: Lake
85.0%
(2022)
Compared to:
CA Counties
The distribution is based on data from 58 California counties.
CA Value
(82.5%)
The regional value is compared to the California state value.
Prior Value
(87.1%)
Prior Value compares a measured value with the previously measured value. Confidence intervals were taken into account in determining the direction of the comparison.
Trend
This comparison measures the indicator’s values over multiple time periods.<br>The Mann-Kendall Test for Statistical Significance is used to evaluate the trend<br>over 4 to 10 periods of measure, subject to data availability and comparability.
Persons with Private Health Insurance Only County: Lake
Persons with Private Health Insurance Only County: Lake
31.7%
(2022)
Compared to:


CA Value
(53.5%)
The regional value is compared to the California state value.
US Value
(54.8%)
The regional value is compared to the national value.
Prior Value
(37.1%)
Prior Value compares a measured value with the previously measured value. Confidence intervals were not taken into account in determining the direction of the comparison.
Trend
This comparison measures the indicator’s values over multiple time periods.<br>The Mann-Kendall Test for Statistical Significance is used to evaluate the trend<br>over 4 to 10 periods of measure, subject to data availability and comparability.
Persons with Public Health Insurance Only County: Lake
Persons with Public Health Insurance Only County: Lake
46.7%
(2022)
Compared to:


CA Value
(29.8%)
The regional value is compared to the California state value.
US Value
(24.8%)
The regional value is compared to the national value.
Prior Value
(35.6%)
Prior Value compares a measured value with the previously measured value. Confidence intervals were not taken into account in determining the direction of the comparison.
Trend
This comparison measures the indicator’s values over multiple time periods.<br>The Mann-Kendall Test for Statistical Significance is used to evaluate the trend<br>over 4 to 10 periods of measure, subject to data availability and comparability.
Primary Care Provider Rate County: Lake
Primary Care Provider Rate County: Lake
42
Providers per 100,000 population
(2021)
Compared to:


CA Counties
The distribution is based on data from 57 California counties.
U.S. Counties
The distribution is based on data from 2,984 U.S. counties and county equivalents.
CA Value
(81)
The regional value is compared to the California state value.
Prior Value
(45)
Prior Value compares a measured value with the previously measured value. Confidence intervals were not taken into account in determining the direction of the comparison.
Trend
This comparison measures the indicator’s values over multiple time periods.<br>The Mann-Kendall Test for Statistical Significance is used to evaluate the trend<br>over 4 to 10 periods of measure, subject to data availability and comparability.
