Search for Indicators
COVID-19 Locating At-Risk Populations
View Our Indicators
Click on an indicator to find a map by city/census place, zip, and/or census tract.
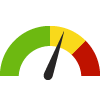
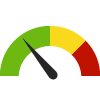
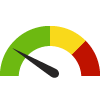
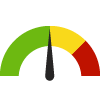
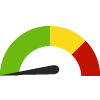
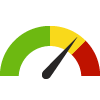
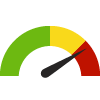
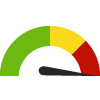
Indicator Gauge Icon Legend
Legend Colors
Red is bad, green is good, blue is not statistically different/neutral.
Compared to Distribution
 the value is in the best half of communities.
 the value is in the 2nd worst quarter of communities.
 the value is in the worst quarter of communities.
Compared to Target
 meets target;
  does not meet target.
Compared to a Single Value
 lower than the comparison value;
 higher than the comparison value;
 not statistically different from comparison value.
Trend

 non-significant change over time;
 significant change over time;
  no change over time.
Compared to Prior Value
 higher than the previous measurement period;
 lower than the previous measurement period;
 no statistically different change from previous measurement period.
 Significantly better than the overall value
 Significantly worse than the overall value
 Significantly different than the overall value
 No significant difference with the overall value
 No data on significance available
COVID-19 Indicators
COVID-19 Daily Average Incidence Rate County: Lake
COVID-19 Daily Average Incidence Rate County: Lake
3.92
Cases per 100,000 population
(Mar 3, 2023)
Compared to:
CA Counties
The distribution is based on data from 58 California counties.
U.S. Counties
The distribution is based on data from 3,142 U.S. counties and county equivalents.
CA Value
(6.23)
The regional value is compared to the California state value.
US Value
(10.97)
The regional value is compared to the national value.
Prior Value
(5.16)
Prior Value compares a measured value with the previously measured value. Confidence intervals were not taken into account in determining the direction of the comparison.
Trend
This comparison measures the indicator’s values over multiple time periods.<br>The Mann-Kendall Test for Statistical Significance is used to evaluate the trend<br>over 4 to 10 periods of measure, subject to data availability and comparability.
COVID-19 Daily Average Case-Fatality Rate County: Lake
COVID-19 Daily Average Case-Fatality Rate County: Lake
0.0
Deaths per 100 cases
(Mar 3, 2023)
Compared to:

CA Counties
(Feb 3, 2023)
The distribution is based on data from 56 California counties.
U.S. Counties
(Mar 25, 2022)
The distribution is based on data from 2,811 U.S. counties and county equivalents.
CA Value
(1.0)
The regional value is compared to the California state value.
US Value
(1.7)
The regional value is compared to the national value.
Prior Value
(0.0)
Prior Value compares a measured value with the previously measured value. Confidence intervals were not taken into account in determining the direction of the comparison.
Trend
This comparison measures the indicator’s values over multiple time periods.<br>The Mann-Kendall Test for Statistical Significance is used to evaluate the trend<br>over 4 to 10 periods of measure, subject to data availability and comparability.
Vulnerable Populations
Adults with Diabetes County: Lake
Adults with Diabetes County: Lake
8.9%
(2021-2022)
Compared to:
CA Counties
The distribution is based on data from 58 California counties.
CA Value
(10.7%)
The regional value is compared to the California state value.
US Value
(11.5% in 2022)
The regional value is compared to the national value. The source for the national value is Behavioral Risk Factor Surveillance System
Prior Value
(11.7%)
Prior Value compares a measured value with the previously measured value. Confidence intervals were taken into account in determining the direction of the comparison.
Trend
This comparison measures the indicator’s values over multiple time periods.<br>The Mann-Kendall Test for Statistical Significance is used to evaluate the trend<br>over 4 to 10 periods of measure, subject to data availability and comparability.
Age-Adjusted Death Rate due to Diabetes County: Lake
Age-Adjusted Death Rate due to Diabetes County: Lake
15.1
Deaths per 100,000 population
(2019-2021)
Compared to:
CA Counties
The distribution is based on data from 57 California counties.
CA Value
(23.1)
The regional value is compared to the California state value.
US Value
(24.8 in 2020)
The regional value is compared to the national value. The source for the national value is Centers for Disease Control and Prevention
Prior Value
(14.6)
Prior Value compares a measured value with the previously measured value. Confidence intervals were taken into account in determining the direction of the comparison.
Diabetes: Medicare Population County: Lake
Diabetes: Medicare Population County: Lake
19.0%
(2022)
Compared to:

CA Counties
The distribution is based on data from 58 California counties.
U.S. Counties
The distribution is based on data from 3,129 U.S. counties and county equivalents.
CA Value
(21.0%)
The regional value is compared to the California state value.
US Value
(24.0%)
The regional value is compared to the national value.
Prior Value
(18.0%)
Prior Value compares a measured value with the previously measured value. Confidence intervals were not taken into account in determining the direction of the comparison.
Trend
This comparison measures the indicator’s values over multiple time periods.<br>The Mann-Kendall Test for Statistical Significance is used to evaluate the trend<br>over 4 to 10 periods of measure, subject to data availability and comparability.
Adults with Disability County: Lake
Adults with Disability County: Lake
49.1%
(2016)
Compared to:


CA Value
(29.7%)
The regional value is compared to the California state value.
US Value
(20.6% in 2015)
The regional value is compared to the national value. The source for the national value is Behavioral Risk Factor Surveillance System
Prior Value
(53.4%)
Prior Value compares a measured value with the previously measured value. Confidence intervals were taken into account in determining the direction of the comparison.
Trend
This comparison measures the indicator’s values over multiple time periods.<br>The Mann-Kendall Test for Statistical Significance is used to evaluate the trend<br>over 4 to 10 periods of measure, subject to data availability and comparability.
Persons with a Disability County: Lake
Persons with a Disability County: Lake
19.8%
(2018-2022)
Compared to:

CA Value
(11.0%)
The regional value is compared to the California state value.
US Value
(12.9%)
The regional value is compared to the national value.
Trend
This comparison measures the indicator’s values over multiple time periods.<br>The Mann-Kendall Test for Statistical Significance is used to evaluate the trend<br>over 4 to 10 periods of measure, subject to data availability and comparability.
Adults with Disability Living in Poverty County: Lake
Adults with Disability Living in Poverty County: Lake
31.8%
(2018-2022)
Compared to:

CA Counties
The distribution is based on data from 58 California counties.
U.S. Counties
The distribution is based on data from 3,132 U.S. counties and county equivalents.
CA Value
(22.7%)
The regional value is compared to the California state value.
US Value
(24.9%)
The regional value is compared to the national value.
Trend
This comparison measures the indicator’s values over multiple time periods.<br>The Mann-Kendall Test for Statistical Significance is used to evaluate the trend<br>over 4 to 10 periods of measure, subject to data availability and comparability.
Asthma: Medicare Population County: Lake
Asthma: Medicare Population County: Lake
5.0%
(2022)
Compared to:
CA Counties
The distribution is based on data from 58 California counties.
U.S. Counties
The distribution is based on data from 3,129 U.S. counties and county equivalents.
CA Value
(7.0%)
The regional value is compared to the California state value.
US Value
(7.0%)
The regional value is compared to the national value.
Prior Value
(5.0%)
Prior Value compares a measured value with the previously measured value. Confidence intervals were not taken into account in determining the direction of the comparison.
Trend
This comparison measures the indicator’s values over multiple time periods.<br>The Mann-Kendall Test for Statistical Significance is used to evaluate the trend<br>over 4 to 10 periods of measure, subject to data availability and comparability.
Families Living Below Poverty Level County: Lake
Families Living Below Poverty Level County: Lake
10.2%
(2018-2022)
Compared to:
CA Counties
The distribution is based on data from 58 California counties.
U.S. Counties
The distribution is based on data from 3,104 U.S. counties and county equivalents.
CA Value
(8.5%)
The regional value is compared to the California state value.
US Value
(8.8%)
The regional value is compared to the national value.
Trend
This comparison measures the indicator’s values over multiple time periods.<br>The Mann-Kendall Test for Statistical Significance is used to evaluate the trend<br>over 4 to 10 periods of measure, subject to data availability and comparability.
Children Living Below Poverty Level County: Lake
Children Living Below Poverty Level County: Lake
21.1%
(2018-2022)
Compared to:
CA Counties
The distribution is based on data from 58 California counties.
U.S. Counties
The distribution is based on data from 3,132 U.S. counties and county equivalents.
CA Value
(15.6%)
The regional value is compared to the California state value.
US Value
(16.7%)
The regional value is compared to the national value.
Trend
This comparison measures the indicator’s values over multiple time periods.<br>The Mann-Kendall Test for Statistical Significance is used to evaluate the trend<br>over 4 to 10 periods of measure, subject to data availability and comparability.
Households Receiving SNAP with Children (Count) County: Lake
Households Receiving SNAP with Children (Count) County: Lake
2,082
Households
(2018-2022)
Compared to:
Trend
This comparison measures the indicator’s values over multiple time periods.<br>The Mann-Kendall Test for Statistical Significance is used to evaluate the trend<br>over 4 to 10 periods of measure, subject to data availability and comparability.
Households Receiving SNAP with Children County: Lake
Households Receiving SNAP with Children County: Lake
42.9%
(2018-2022)
Compared to:

CA Value
(53.1%)
The regional value is compared to the California state value.
US Value
(47.9%)
The regional value is compared to the national value.
Trend
This comparison measures the indicator’s values over multiple time periods.<br>The Mann-Kendall Test for Statistical Significance is used to evaluate the trend<br>over 4 to 10 periods of measure, subject to data availability and comparability.
Total Homeless Population County: Lake
Total Homeless Population County: Lake
339
Persons
(2022)
Compared to:
Prior Value
(306)
Prior Value compares a measured value with the previously measured value. Confidence intervals were not taken into account in determining the direction of the comparison.
Trend
This comparison measures the indicator’s values over multiple time periods.<br>The Mann-Kendall Test for Statistical Significance is used to evaluate the trend<br>over 4 to 10 periods of measure, subject to data availability and comparability.
Unsheltered Homeless County: Lake
Unsheltered Homeless County: Lake
259
Persons
(2022)
Compared to:
Prior Value
(231)
Prior Value compares a measured value with the previously measured value. Confidence intervals were not taken into account in determining the direction of the comparison.
Trend
This comparison measures the indicator’s values over multiple time periods.<br>The Mann-Kendall Test for Statistical Significance is used to evaluate the trend<br>over 4 to 10 periods of measure, subject to data availability and comparability.
Sheltered Homeless County: Lake
Sheltered Homeless County: Lake
80
Persons
(2022)
Compared to:
Prior Value
(75)
Prior Value compares a measured value with the previously measured value. Confidence intervals were not taken into account in determining the direction of the comparison.
Trend
This comparison measures the indicator’s values over multiple time periods.<br>The Mann-Kendall Test for Statistical Significance is used to evaluate the trend<br>over 4 to 10 periods of measure, subject to data availability and comparability.
Vulnerable Populations 65+
Population Over Age 65 (Count) County: Lake
Population Over Age 65 (Count) County: Lake
15,801
People
(2018-2022)
Compared to:

Trend
This comparison measures the indicator’s values over multiple time periods.<br>The Mann-Kendall Test for Statistical Significance is used to evaluate the trend<br>over 4 to 10 periods of measure, subject to data availability and comparability.
People 65+ Living Alone (Count) County: Lake
People 65+ Living Alone (Count) County: Lake
4,442
People
(2018-2022)
Compared to:
Trend
This comparison measures the indicator’s values over multiple time periods.<br>The Mann-Kendall Test for Statistical Significance is used to evaluate the trend<br>over 4 to 10 periods of measure, subject to data availability and comparability.
People 65+ Living Alone County: Lake
People 65+ Living Alone County: Lake
28.1%
(2018-2022)
Compared to:
CA Counties
The distribution is based on data from 58 California counties.
U.S. Counties
The distribution is based on data from 3,133 U.S. counties and county equivalents.
CA Value
(22.0%)
The regional value is compared to the California state value.
US Value
(26.4%)
The regional value is compared to the national value.
Trend
This comparison measures the indicator’s values over multiple time periods.<br>The Mann-Kendall Test for Statistical Significance is used to evaluate the trend<br>over 4 to 10 periods of measure, subject to data availability and comparability.
People 65+ Living Below Poverty Level (Count) County: Lake
People 65+ Living Below Poverty Level (Count) County: Lake
1,571
People
(2018-2022)
Compared to:
Trend
This comparison measures the indicator’s values over multiple time periods.<br>The Mann-Kendall Test for Statistical Significance is used to evaluate the trend<br>over 4 to 10 periods of measure, subject to data availability and comparability.
People 65+ Living Below Poverty Level County: Lake
People 65+ Living Below Poverty Level County: Lake
10.1%
(2018-2022)
Compared to:
CA Counties
The distribution is based on data from 58 California counties.
U.S. Counties
The distribution is based on data from 3,133 U.S. counties and county equivalents.
CA Value
(11.0%)
The regional value is compared to the California state value.
US Value
(10.0%)
The regional value is compared to the national value.
Trend
This comparison measures the indicator’s values over multiple time periods.<br>The Mann-Kendall Test for Statistical Significance is used to evaluate the trend<br>over 4 to 10 periods of measure, subject to data availability and comparability.
Adults 65+ with a Hearing Difficulty County: Lake
Adults 65+ with a Hearing Difficulty County: Lake
18.8%
(2018-2022)
Compared to:
CA Value
(12.9%)
The regional value is compared to the California state value.
US Value
(13.7%)
The regional value is compared to the national value.
Trend
This comparison measures the indicator’s values over multiple time periods.<br>The Mann-Kendall Test for Statistical Significance is used to evaluate the trend<br>over 4 to 10 periods of measure, subject to data availability and comparability.
Adults 65+ with a Self-Care Difficulty County: Lake
Adults 65+ with a Self-Care Difficulty County: Lake
11.4%
(2018-2022)
Compared to:

CA Value
(9.5%)
The regional value is compared to the California state value.
US Value
(7.4%)
The regional value is compared to the national value.
Trend
This comparison measures the indicator’s values over multiple time periods.<br>The Mann-Kendall Test for Statistical Significance is used to evaluate the trend<br>over 4 to 10 periods of measure, subject to data availability and comparability.
Adults 65+ with a Vision Difficulty County: Lake
Adults 65+ with a Vision Difficulty County: Lake
7.8%
(2018-2022)
Compared to:
CA Value
(6.1%)
The regional value is compared to the California state value.
US Value
(6.0%)
The regional value is compared to the national value.
Trend
This comparison measures the indicator’s values over multiple time periods.<br>The Mann-Kendall Test for Statistical Significance is used to evaluate the trend<br>over 4 to 10 periods of measure, subject to data availability and comparability.
Adults 65+ with an Independent Living Difficulty County: Lake
Adults 65+ with an Independent Living Difficulty County: Lake
15.9%
(2018-2022)
Compared to:
CA Value
(16.4%)
The regional value is compared to the California state value.
US Value
(13.6%)
The regional value is compared to the national value.
Trend
This comparison measures the indicator’s values over multiple time periods.<br>The Mann-Kendall Test for Statistical Significance is used to evaluate the trend<br>over 4 to 10 periods of measure, subject to data availability and comparability.
Adults 65+ with a Disability County: Lake
Adults 65+ with a Disability County: Lake
39.8%
(2018-2022)
Compared to:
CA Value
(33.5%)
The regional value is compared to the California state value.
US Value
(33.3%)
The regional value is compared to the national value.
Trend
This comparison measures the indicator’s values over multiple time periods.<br>The Mann-Kendall Test for Statistical Significance is used to evaluate the trend<br>over 4 to 10 periods of measure, subject to data availability and comparability.
