Search for Indicators
Poverty and Income
Indicator Gauge Icon Legend
Legend Colors
Red is bad, green is good, blue is not statistically different/neutral.
Compared to Distribution
 the value is in the best half of communities.
 the value is in the 2nd worst quarter of communities.
 the value is in the worst quarter of communities.
Compared to Target
 meets target;
  does not meet target.
Compared to a Single Value
 lower than the comparison value;
 higher than the comparison value;
 not statistically different from comparison value.
Trend

 non-significant change over time;
 significant change over time;
  no change over time.
Compared to Prior Value
 higher than the previous measurement period;
 lower than the previous measurement period;
 no statistically different change from previous measurement period.
Health / Disabilities
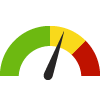
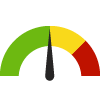
Adults with Disability Living in Poverty County: Lake
Adults with Disability Living in Poverty County: Lake
31.8%
(2018-2022)
Compared to:

CA Counties
The distribution is based on data from 58 California counties.
U.S. Counties
The distribution is based on data from 3,132 U.S. counties and county equivalents.
CA Value
(22.7%)
The regional value is compared to the California state value.
US Value
(24.9%)
The regional value is compared to the national value.
Trend
This comparison measures the indicator’s values over multiple time periods.<br>The Mann-Kendall Test for Statistical Significance is used to evaluate the trend<br>over 4 to 10 periods of measure, subject to data availability and comparability.
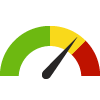
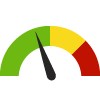
Adults with Disability Living in Poverty Census Place: Clearlake
Adults with Disability Living in Poverty Census Place: Clearlake
44.8%
(2018-2022)
Compared to:

CA Census Places
The distribution is based on data from 1,327 locales.
U.S. Census Places
The distribution is based on data from 27,025 U.S. Census Places.
Lake, CA County Value
(31.8%)
The regional value is compared to the Lake County value.
CA Value
(22.7%)
The regional value is compared to the California state value.
US Value
(24.9%)
The regional value is compared to the national value.
Trend
This comparison measures the indicator’s values over multiple time periods.<br>The Mann-Kendall Test for Statistical Significance is used to evaluate the trend<br>over 4 to 10 periods of measure, subject to data availability and comparability.
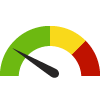
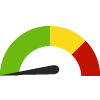
Adults with Disability Living in Poverty Census Place: Clearlake Oaks
Adults with Disability Living in Poverty Census Place: Clearlake Oaks
26.2%
(2018-2022)
Compared to:
CA Census Places
The distribution is based on data from 1,327 locales.
U.S. Census Places
The distribution is based on data from 27,025 U.S. Census Places.
Lake, CA County Value
(31.8%)
The regional value is compared to the Lake County value.
CA Value
(22.7%)
The regional value is compared to the California state value.
US Value
(24.9%)
The regional value is compared to the national value.
Trend
This comparison measures the indicator’s values over multiple time periods.<br>The Mann-Kendall Test for Statistical Significance is used to evaluate the trend<br>over 4 to 10 periods of measure, subject to data availability and comparability.
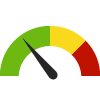
Adults with Disability Living in Poverty Census Place: Clearlake Riviera
Adults with Disability Living in Poverty Census Place: Clearlake Riviera
0.0%
(2018-2022)
Compared to:
CA Census Places
The distribution is based on data from 1,327 locales.
U.S. Census Places
The distribution is based on data from 27,025 U.S. Census Places.
Lake, CA County Value
(31.8%)
The regional value is compared to the Lake County value.
CA Value
(22.7%)
The regional value is compared to the California state value.
US Value
(24.9%)
The regional value is compared to the national value.
Trend
This comparison measures the indicator’s values over multiple time periods.<br>The Mann-Kendall Test for Statistical Significance is used to evaluate the trend<br>over 4 to 10 periods of measure, subject to data availability and comparability.
Adults with Disability Living in Poverty Census Place: Cobb
Adults with Disability Living in Poverty Census Place: Cobb
33.8%
(2018-2022)
Compared to:


CA Census Places
The distribution is based on data from 1,327 locales.
U.S. Census Places
The distribution is based on data from 27,025 U.S. Census Places.
Lake, CA County Value
(31.8%)
The regional value is compared to the Lake County value.
CA Value
(22.7%)
The regional value is compared to the California state value.
US Value
(24.9%)
The regional value is compared to the national value.
Trend
This comparison measures the indicator’s values over multiple time periods.<br>The Mann-Kendall Test for Statistical Significance is used to evaluate the trend<br>over 4 to 10 periods of measure, subject to data availability and comparability.
Adults with Disability Living in Poverty Census Place: Hidden Valley Lake
Adults with Disability Living in Poverty Census Place: Hidden Valley Lake
8.4%
(2018-2022)
Compared to:

CA Census Places
The distribution is based on data from 1,327 locales.
U.S. Census Places
The distribution is based on data from 27,025 U.S. Census Places.
Lake, CA County Value
(31.8%)
The regional value is compared to the Lake County value.
CA Value
(22.7%)
The regional value is compared to the California state value.
US Value
(24.9%)
The regional value is compared to the national value.
Trend
This comparison measures the indicator’s values over multiple time periods.<br>The Mann-Kendall Test for Statistical Significance is used to evaluate the trend<br>over 4 to 10 periods of measure, subject to data availability and comparability.
Adults with Disability Living in Poverty Census Place: Kelseyville
Adults with Disability Living in Poverty Census Place: Kelseyville
37.1%
(2018-2022)
Compared to:
CA Census Places
The distribution is based on data from 1,327 locales.
U.S. Census Places
The distribution is based on data from 27,025 U.S. Census Places.
Lake, CA County Value
(31.8%)
The regional value is compared to the Lake County value.
CA Value
(22.7%)
The regional value is compared to the California state value.
US Value
(24.9%)
The regional value is compared to the national value.
Trend
This comparison measures the indicator’s values over multiple time periods.<br>The Mann-Kendall Test for Statistical Significance is used to evaluate the trend<br>over 4 to 10 periods of measure, subject to data availability and comparability.
Adults with Disability Living in Poverty Census Place: Lakeport
Adults with Disability Living in Poverty Census Place: Lakeport
33.1%
(2018-2022)
Compared to:
CA Census Places
The distribution is based on data from 1,327 locales.
U.S. Census Places
The distribution is based on data from 27,025 U.S. Census Places.
Lake, CA County Value
(31.8%)
The regional value is compared to the Lake County value.
CA Value
(22.7%)
The regional value is compared to the California state value.
US Value
(24.9%)
The regional value is compared to the national value.
Trend
This comparison measures the indicator’s values over multiple time periods.<br>The Mann-Kendall Test for Statistical Significance is used to evaluate the trend<br>over 4 to 10 periods of measure, subject to data availability and comparability.
Adults with Disability Living in Poverty Census Place: Lower Lake
Adults with Disability Living in Poverty Census Place: Lower Lake
76.6%
(2018-2022)
Compared to:
CA Census Places
The distribution is based on data from 1,327 locales.
U.S. Census Places
The distribution is based on data from 27,025 U.S. Census Places.
Lake, CA County Value
(31.8%)
The regional value is compared to the Lake County value.
CA Value
(22.7%)
The regional value is compared to the California state value.
US Value
(24.9%)
The regional value is compared to the national value.
Trend
This comparison measures the indicator’s values over multiple time periods.<br>The Mann-Kendall Test for Statistical Significance is used to evaluate the trend<br>over 4 to 10 periods of measure, subject to data availability and comparability.
Adults with Disability Living in Poverty Census Place: Lucerne
Adults with Disability Living in Poverty Census Place: Lucerne
22.2%
(2018-2022)
Compared to:
CA Census Places
The distribution is based on data from 1,327 locales.
U.S. Census Places
The distribution is based on data from 27,025 U.S. Census Places.
Lake, CA County Value
(31.8%)
The regional value is compared to the Lake County value.
CA Value
(22.7%)
The regional value is compared to the California state value.
US Value
(24.9%)
The regional value is compared to the national value.
Trend
This comparison measures the indicator’s values over multiple time periods.<br>The Mann-Kendall Test for Statistical Significance is used to evaluate the trend<br>over 4 to 10 periods of measure, subject to data availability and comparability.
Adults with Disability Living in Poverty Census Place: Middletown
Adults with Disability Living in Poverty Census Place: Middletown
14.1%
(2018-2022)
Compared to:
CA Census Places
The distribution is based on data from 1,327 locales.
U.S. Census Places
The distribution is based on data from 27,025 U.S. Census Places.
Lake, CA County Value
(31.8%)
The regional value is compared to the Lake County value.
CA Value
(22.7%)
The regional value is compared to the California state value.
US Value
(24.9%)
The regional value is compared to the national value.
Trend
This comparison measures the indicator’s values over multiple time periods.<br>The Mann-Kendall Test for Statistical Significance is used to evaluate the trend<br>over 4 to 10 periods of measure, subject to data availability and comparability.
Adults with Disability Living in Poverty Census Place: Nice
Adults with Disability Living in Poverty Census Place: Nice
12.8%
(2018-2022)
Compared to:
CA Census Places
The distribution is based on data from 1,327 locales.
U.S. Census Places
The distribution is based on data from 27,025 U.S. Census Places.
Lake, CA County Value
(31.8%)
The regional value is compared to the Lake County value.
CA Value
(22.7%)
The regional value is compared to the California state value.
US Value
(24.9%)
The regional value is compared to the national value.
Trend
This comparison measures the indicator’s values over multiple time periods.<br>The Mann-Kendall Test for Statistical Significance is used to evaluate the trend<br>over 4 to 10 periods of measure, subject to data availability and comparability.
Adults with Disability Living in Poverty Census Place: North Lakeport
Adults with Disability Living in Poverty Census Place: North Lakeport
8.7%
(2018-2022)
Compared to:
CA Census Places
The distribution is based on data from 1,327 locales.
U.S. Census Places
The distribution is based on data from 27,025 U.S. Census Places.
Lake, CA County Value
(31.8%)
The regional value is compared to the Lake County value.
CA Value
(22.7%)
The regional value is compared to the California state value.
US Value
(24.9%)
The regional value is compared to the national value.
Trend
This comparison measures the indicator’s values over multiple time periods.<br>The Mann-Kendall Test for Statistical Significance is used to evaluate the trend<br>over 4 to 10 periods of measure, subject to data availability and comparability.
Adults with Disability Living in Poverty Census Place: Soda Bay
Adults with Disability Living in Poverty Census Place: Soda Bay
27.8%
(2018-2022)
Compared to:
CA Census Places
The distribution is based on data from 1,327 locales.
U.S. Census Places
The distribution is based on data from 27,025 U.S. Census Places.
Lake, CA County Value
(31.8%)
The regional value is compared to the Lake County value.
CA Value
(22.7%)
The regional value is compared to the California state value.
US Value
(24.9%)
The regional value is compared to the national value.
Trend
This comparison measures the indicator’s values over multiple time periods.<br>The Mann-Kendall Test for Statistical Significance is used to evaluate the trend<br>over 4 to 10 periods of measure, subject to data availability and comparability.
Adults with Disability Living in Poverty Census Place: Spring Valley
Adults with Disability Living in Poverty Census Place: Spring Valley
31.7%
(2018-2022)
Compared to:
CA Census Places
The distribution is based on data from 1,327 locales.
U.S. Census Places
The distribution is based on data from 27,025 U.S. Census Places.
Lake, CA County Value
(31.8%)
The regional value is compared to the Lake County value.
CA Value
(22.7%)
The regional value is compared to the California state value.
US Value
(24.9%)
The regional value is compared to the national value.
Trend
This comparison measures the indicator’s values over multiple time periods.<br>The Mann-Kendall Test for Statistical Significance is used to evaluate the trend<br>over 4 to 10 periods of measure, subject to data availability and comparability.
Adults with Disability Living in Poverty Census Place: Upper Lake
Adults with Disability Living in Poverty Census Place: Upper Lake
60.0%
(2018-2022)
Compared to:
CA Census Places
The distribution is based on data from 1,327 locales.
U.S. Census Places
The distribution is based on data from 27,025 U.S. Census Places.
Lake, CA County Value
(31.8%)
The regional value is compared to the Lake County value.
CA Value
(22.7%)
The regional value is compared to the California state value.
US Value
(24.9%)
The regional value is compared to the national value.
Trend
This comparison measures the indicator’s values over multiple time periods.<br>The Mann-Kendall Test for Statistical Significance is used to evaluate the trend<br>over 4 to 10 periods of measure, subject to data availability and comparability.
Adults with Disability Living in Poverty Zip Code: 95422
Adults with Disability Living in Poverty Zip Code: 95422
44.4%
(2018-2022)
Compared to:
CA Zip Codes
The distribution is based on data from 1,625 California zip codes.
U.S. Zip Codes
The distribution is based on data from 30,884 U.S. zip codes.
Lake, CA County Value
(31.8%)
The regional value is compared to the Lake County value.
Trend
This comparison measures the indicator’s values over multiple time periods.<br>The Mann-Kendall Test for Statistical Significance is used to evaluate the trend<br>over 4 to 10 periods of measure, subject to data availability and comparability.
Adults with Disability Living in Poverty Zip Code: 95423
Adults with Disability Living in Poverty Zip Code: 95423
28.5%
(2018-2022)
Compared to:
CA Zip Codes
The distribution is based on data from 1,625 California zip codes.
U.S. Zip Codes
The distribution is based on data from 30,884 U.S. zip codes.
Lake, CA County Value
(31.8%)
The regional value is compared to the Lake County value.
Trend
This comparison measures the indicator’s values over multiple time periods.<br>The Mann-Kendall Test for Statistical Significance is used to evaluate the trend<br>over 4 to 10 periods of measure, subject to data availability and comparability.
Adults with Disability Living in Poverty Zip Code: 95426
Adults with Disability Living in Poverty Zip Code: 95426
22.2%
(2018-2022)
Compared to:
CA Zip Codes
The distribution is based on data from 1,625 California zip codes.
U.S. Zip Codes
The distribution is based on data from 30,884 U.S. zip codes.
Lake, CA County Value
(31.8%)
The regional value is compared to the Lake County value.
Trend
This comparison measures the indicator’s values over multiple time periods.<br>The Mann-Kendall Test for Statistical Significance is used to evaluate the trend<br>over 4 to 10 periods of measure, subject to data availability and comparability.
Adults with Disability Living in Poverty Zip Code: 95443
Adults with Disability Living in Poverty Zip Code: 95443
100.0%
(2018-2022)
Compared to:
CA Zip Codes
The distribution is based on data from 1,625 California zip codes.
U.S. Zip Codes
The distribution is based on data from 30,884 U.S. zip codes.
Lake, CA County Value
(31.8%)
The regional value is compared to the Lake County value.
Trend
This comparison measures the indicator’s values over multiple time periods.<br>The Mann-Kendall Test for Statistical Significance is used to evaluate the trend<br>over 4 to 10 periods of measure, subject to data availability and comparability.
Adults with Disability Living in Poverty Zip Code: 95451
Adults with Disability Living in Poverty Zip Code: 95451
21.9%
(2018-2022)
Compared to:
CA Zip Codes
The distribution is based on data from 1,625 California zip codes.
U.S. Zip Codes
The distribution is based on data from 30,884 U.S. zip codes.
Lake, CA County Value
(31.8%)
The regional value is compared to the Lake County value.
Trend
This comparison measures the indicator’s values over multiple time periods.<br>The Mann-Kendall Test for Statistical Significance is used to evaluate the trend<br>over 4 to 10 periods of measure, subject to data availability and comparability.
Adults with Disability Living in Poverty Zip Code: 95453
Adults with Disability Living in Poverty Zip Code: 95453
33.8%
(2018-2022)
Compared to:
CA Zip Codes
The distribution is based on data from 1,625 California zip codes.
U.S. Zip Codes
The distribution is based on data from 30,884 U.S. zip codes.
Lake, CA County Value
(31.8%)
The regional value is compared to the Lake County value.
Trend
This comparison measures the indicator’s values over multiple time periods.<br>The Mann-Kendall Test for Statistical Significance is used to evaluate the trend<br>over 4 to 10 periods of measure, subject to data availability and comparability.
Adults with Disability Living in Poverty Zip Code: 95457
Adults with Disability Living in Poverty Zip Code: 95457
69.5%
(2018-2022)
Compared to:
CA Zip Codes
The distribution is based on data from 1,625 California zip codes.
U.S. Zip Codes
The distribution is based on data from 30,884 U.S. zip codes.
Lake, CA County Value
(31.8%)
The regional value is compared to the Lake County value.
Trend
This comparison measures the indicator’s values over multiple time periods.<br>The Mann-Kendall Test for Statistical Significance is used to evaluate the trend<br>over 4 to 10 periods of measure, subject to data availability and comparability.
Adults with Disability Living in Poverty Zip Code: 95458
Adults with Disability Living in Poverty Zip Code: 95458
19.5%
(2018-2022)
Compared to:
CA Zip Codes
The distribution is based on data from 1,625 California zip codes.
U.S. Zip Codes
The distribution is based on data from 30,884 U.S. zip codes.
Lake, CA County Value
(31.8%)
The regional value is compared to the Lake County value.
Trend
This comparison measures the indicator’s values over multiple time periods.<br>The Mann-Kendall Test for Statistical Significance is used to evaluate the trend<br>over 4 to 10 periods of measure, subject to data availability and comparability.
Adults with Disability Living in Poverty Zip Code: 95461
Adults with Disability Living in Poverty Zip Code: 95461
14.9%
(2018-2022)
Compared to:
CA Zip Codes
The distribution is based on data from 1,625 California zip codes.
U.S. Zip Codes
The distribution is based on data from 30,884 U.S. zip codes.
Lake, CA County Value
(31.8%)
The regional value is compared to the Lake County value.
Trend
This comparison measures the indicator’s values over multiple time periods.<br>The Mann-Kendall Test for Statistical Significance is used to evaluate the trend<br>over 4 to 10 periods of measure, subject to data availability and comparability.
Adults with Disability Living in Poverty Zip Code: 95464
Adults with Disability Living in Poverty Zip Code: 95464
13.9%
(2018-2022)
Compared to:
CA Zip Codes
The distribution is based on data from 1,625 California zip codes.
U.S. Zip Codes
The distribution is based on data from 30,884 U.S. zip codes.
Lake, CA County Value
(31.8%)
The regional value is compared to the Lake County value.
Trend
This comparison measures the indicator’s values over multiple time periods.<br>The Mann-Kendall Test for Statistical Significance is used to evaluate the trend<br>over 4 to 10 periods of measure, subject to data availability and comparability.
Adults with Disability Living in Poverty Zip Code: 95467
Adults with Disability Living in Poverty Zip Code: 95467
8.8%
(2018-2022)
Compared to:
CA Zip Codes
The distribution is based on data from 1,625 California zip codes.
U.S. Zip Codes
The distribution is based on data from 30,884 U.S. zip codes.
Lake, CA County Value
(31.8%)
The regional value is compared to the Lake County value.
Trend
This comparison measures the indicator’s values over multiple time periods.<br>The Mann-Kendall Test for Statistical Significance is used to evaluate the trend<br>over 4 to 10 periods of measure, subject to data availability and comparability.
Adults with Disability Living in Poverty Zip Code: 95485
Adults with Disability Living in Poverty Zip Code: 95485
30.4%
(2018-2022)
Compared to:
CA Zip Codes
The distribution is based on data from 1,625 California zip codes.
U.S. Zip Codes
The distribution is based on data from 30,884 U.S. zip codes.
Lake, CA County Value
(31.8%)
The regional value is compared to the Lake County value.
Trend
This comparison measures the indicator’s values over multiple time periods.<br>The Mann-Kendall Test for Statistical Significance is used to evaluate the trend<br>over 4 to 10 periods of measure, subject to data availability and comparability.
Adults with Disability Living in Poverty Zip Code: 95493
Adults with Disability Living in Poverty Zip Code: 95493
0.0%
(2018-2022)
Compared to:
CA Zip Codes
The distribution is based on data from 1,625 California zip codes.
U.S. Zip Codes
The distribution is based on data from 30,884 U.S. zip codes.
Lake, CA County Value
(31.8%)
The regional value is compared to the Lake County value.
Adults with Disability Living in Poverty Census Tract: 06033000100
Adults with Disability Living in Poverty Census Tract: 06033000100
46.2%
(2018-2022)
Compared to:
CA Census Tracts
The distribution is based on data from 8,997 California census tracts.
U.S. Census Tracts
The distribution is based on data from 82,173 U.S. census tracts.
Lake, CA County Value
(31.8%)
The regional value is compared to the Lake County value.
Trend
This comparison measures the indicator’s values over multiple time periods.<br>The Mann-Kendall Test for Statistical Significance is used to evaluate the trend<br>over 4 to 10 periods of measure, subject to data availability and comparability.
Adults with Disability Living in Poverty Census Tract: 06033000300
Adults with Disability Living in Poverty Census Tract: 06033000300
10.1%
(2018-2022)
Compared to:
CA Census Tracts
The distribution is based on data from 8,997 California census tracts.
U.S. Census Tracts
The distribution is based on data from 82,173 U.S. census tracts.
Lake, CA County Value
(31.8%)
The regional value is compared to the Lake County value.
Trend
This comparison measures the indicator’s values over multiple time periods.<br>The Mann-Kendall Test for Statistical Significance is used to evaluate the trend<br>over 4 to 10 periods of measure, subject to data availability and comparability.
Adults with Disability Living in Poverty Census Tract: 06033000400
Adults with Disability Living in Poverty Census Tract: 06033000400
19.3%
(2015-2019)
Compared to:
CA Census Tracts
The distribution is based on data from 7,965 California census tracts.
U.S. Census Tracts
The distribution is based on data from 72,077 U.S. census tracts.
Lake, CA County Value
(31.2%)
The regional value is compared to the Lake County value.
Trend
This comparison measures the indicator’s values over multiple time periods.<br>The Mann-Kendall Test for Statistical Significance is used to evaluate the trend<br>over 4 to 10 periods of measure, subject to data availability and comparability.
Adults with Disability Living in Poverty Census Tract: 06033000401
Adults with Disability Living in Poverty Census Tract: 06033000401
13.3%
(2018-2022)
Compared to:
CA Census Tracts
The distribution is based on data from 8,997 California census tracts.
U.S. Census Tracts
The distribution is based on data from 82,173 U.S. census tracts.
Lake, CA County Value
(31.8%)
The regional value is compared to the Lake County value.
Adults with Disability Living in Poverty Census Tract: 06033000402
Adults with Disability Living in Poverty Census Tract: 06033000402
40.0%
(2018-2022)
Compared to:
CA Census Tracts
The distribution is based on data from 8,997 California census tracts.
U.S. Census Tracts
The distribution is based on data from 82,173 U.S. census tracts.
Lake, CA County Value
(31.8%)
The regional value is compared to the Lake County value.
Adults with Disability Living in Poverty Census Tract: 06033000501
Adults with Disability Living in Poverty Census Tract: 06033000501
22.7%
(2018-2022)
Compared to:
CA Census Tracts
The distribution is based on data from 8,997 California census tracts.
U.S. Census Tracts
The distribution is based on data from 82,173 U.S. census tracts.
Lake, CA County Value
(31.8%)
The regional value is compared to the Lake County value.
Trend
This comparison measures the indicator’s values over multiple time periods.<br>The Mann-Kendall Test for Statistical Significance is used to evaluate the trend<br>over 4 to 10 periods of measure, subject to data availability and comparability.
Adults with Disability Living in Poverty Census Tract: 06033000502
Adults with Disability Living in Poverty Census Tract: 06033000502
11.4%
(2018-2022)
Compared to:
CA Census Tracts
The distribution is based on data from 8,997 California census tracts.
U.S. Census Tracts
The distribution is based on data from 82,173 U.S. census tracts.
Lake, CA County Value
(31.8%)
The regional value is compared to the Lake County value.
Trend
This comparison measures the indicator’s values over multiple time periods.<br>The Mann-Kendall Test for Statistical Significance is used to evaluate the trend<br>over 4 to 10 periods of measure, subject to data availability and comparability.
Adults with Disability Living in Poverty Census Tract: 06033000600
Adults with Disability Living in Poverty Census Tract: 06033000600
26.2%
(2015-2019)
Compared to:
CA Census Tracts
The distribution is based on data from 7,965 California census tracts.
U.S. Census Tracts
The distribution is based on data from 72,077 U.S. census tracts.
Lake, CA County Value
(31.2%)
The regional value is compared to the Lake County value.
Trend
This comparison measures the indicator’s values over multiple time periods.<br>The Mann-Kendall Test for Statistical Significance is used to evaluate the trend<br>over 4 to 10 periods of measure, subject to data availability and comparability.
Adults with Disability Living in Poverty Census Tract: 06033000601
Adults with Disability Living in Poverty Census Tract: 06033000601
24.4%
(2018-2022)
Compared to:
CA Census Tracts
The distribution is based on data from 8,997 California census tracts.
U.S. Census Tracts
The distribution is based on data from 82,173 U.S. census tracts.
Lake, CA County Value
(31.8%)
The regional value is compared to the Lake County value.
Adults with Disability Living in Poverty Census Tract: 06033000602
Adults with Disability Living in Poverty Census Tract: 06033000602
32.0%
(2018-2022)
Compared to:
CA Census Tracts
The distribution is based on data from 8,997 California census tracts.
U.S. Census Tracts
The distribution is based on data from 82,173 U.S. census tracts.
Lake, CA County Value
(31.8%)
The regional value is compared to the Lake County value.
Adults with Disability Living in Poverty Census Tract: 06033000701
Adults with Disability Living in Poverty Census Tract: 06033000701
36.2%
(2015-2019)
Compared to:
CA Census Tracts
The distribution is based on data from 7,965 California census tracts.
U.S. Census Tracts
The distribution is based on data from 72,077 U.S. census tracts.
Lake, CA County Value
(31.2%)
The regional value is compared to the Lake County value.
Trend
This comparison measures the indicator’s values over multiple time periods.<br>The Mann-Kendall Test for Statistical Significance is used to evaluate the trend<br>over 4 to 10 periods of measure, subject to data availability and comparability.
Adults with Disability Living in Poverty Census Tract: 06033000702
Adults with Disability Living in Poverty Census Tract: 06033000702
56.8%
(2018-2022)
Compared to:
CA Census Tracts
The distribution is based on data from 8,997 California census tracts.
U.S. Census Tracts
The distribution is based on data from 82,173 U.S. census tracts.
Lake, CA County Value
(31.8%)
The regional value is compared to the Lake County value.
Trend
This comparison measures the indicator’s values over multiple time periods.<br>The Mann-Kendall Test for Statistical Significance is used to evaluate the trend<br>over 4 to 10 periods of measure, subject to data availability and comparability.
Adults with Disability Living in Poverty Census Tract: 06033000703
Adults with Disability Living in Poverty Census Tract: 06033000703
53.9%
(2018-2022)
Compared to:
CA Census Tracts
The distribution is based on data from 8,997 California census tracts.
U.S. Census Tracts
The distribution is based on data from 82,173 U.S. census tracts.
Lake, CA County Value
(31.8%)
The regional value is compared to the Lake County value.
Adults with Disability Living in Poverty Census Tract: 06033000704
Adults with Disability Living in Poverty Census Tract: 06033000704
21.4%
(2018-2022)
Compared to:
CA Census Tracts
The distribution is based on data from 8,997 California census tracts.
U.S. Census Tracts
The distribution is based on data from 82,173 U.S. census tracts.
Lake, CA County Value
(31.8%)
The regional value is compared to the Lake County value.
Adults with Disability Living in Poverty Census Tract: 06033000801
Adults with Disability Living in Poverty Census Tract: 06033000801
37.3%
(2018-2022)
Compared to:
CA Census Tracts
The distribution is based on data from 8,997 California census tracts.
U.S. Census Tracts
The distribution is based on data from 82,173 U.S. census tracts.
Lake, CA County Value
(31.8%)
The regional value is compared to the Lake County value.
Trend
This comparison measures the indicator’s values over multiple time periods.<br>The Mann-Kendall Test for Statistical Significance is used to evaluate the trend<br>over 4 to 10 periods of measure, subject to data availability and comparability.
Adults with Disability Living in Poverty Census Tract: 06033000802
Adults with Disability Living in Poverty Census Tract: 06033000802
47.9%
(2018-2022)
Compared to:
CA Census Tracts
The distribution is based on data from 8,997 California census tracts.
U.S. Census Tracts
The distribution is based on data from 82,173 U.S. census tracts.
Lake, CA County Value
(31.8%)
The regional value is compared to the Lake County value.
Trend
This comparison measures the indicator’s values over multiple time periods.<br>The Mann-Kendall Test for Statistical Significance is used to evaluate the trend<br>over 4 to 10 periods of measure, subject to data availability and comparability.
Adults with Disability Living in Poverty Census Tract: 06033000900
Adults with Disability Living in Poverty Census Tract: 06033000900
27.4%
(2015-2019)
Compared to:
CA Census Tracts
The distribution is based on data from 7,965 California census tracts.
U.S. Census Tracts
The distribution is based on data from 72,077 U.S. census tracts.
Lake, CA County Value
(31.2%)
The regional value is compared to the Lake County value.
Trend
This comparison measures the indicator’s values over multiple time periods.<br>The Mann-Kendall Test for Statistical Significance is used to evaluate the trend<br>over 4 to 10 periods of measure, subject to data availability and comparability.
Adults with Disability Living in Poverty Census Tract: 06033000901
Adults with Disability Living in Poverty Census Tract: 06033000901
2.7%
(2018-2022)
Compared to:
CA Census Tracts
The distribution is based on data from 8,997 California census tracts.
U.S. Census Tracts
The distribution is based on data from 82,173 U.S. census tracts.
Lake, CA County Value
(31.8%)
The regional value is compared to the Lake County value.
Adults with Disability Living in Poverty Census Tract: 06033000902
Adults with Disability Living in Poverty Census Tract: 06033000902
26.9%
(2018-2022)
Compared to:
CA Census Tracts
The distribution is based on data from 8,997 California census tracts.
U.S. Census Tracts
The distribution is based on data from 82,173 U.S. census tracts.
Lake, CA County Value
(31.8%)
The regional value is compared to the Lake County value.
Adults with Disability Living in Poverty Census Tract: 06033001000
Adults with Disability Living in Poverty Census Tract: 06033001000
48.6%
(2018-2022)
Compared to:
CA Census Tracts
The distribution is based on data from 8,997 California census tracts.
U.S. Census Tracts
The distribution is based on data from 82,173 U.S. census tracts.
Lake, CA County Value
(31.8%)
The regional value is compared to the Lake County value.
Trend
This comparison measures the indicator’s values over multiple time periods.<br>The Mann-Kendall Test for Statistical Significance is used to evaluate the trend<br>over 4 to 10 periods of measure, subject to data availability and comparability.
Adults with Disability Living in Poverty Census Tract: 06033001100
Adults with Disability Living in Poverty Census Tract: 06033001100
34.8%
(2015-2019)
Compared to:
CA Census Tracts
The distribution is based on data from 7,965 California census tracts.
U.S. Census Tracts
The distribution is based on data from 72,077 U.S. census tracts.
Lake, CA County Value
(31.2%)
The regional value is compared to the Lake County value.
Trend
This comparison measures the indicator’s values over multiple time periods.<br>The Mann-Kendall Test for Statistical Significance is used to evaluate the trend<br>over 4 to 10 periods of measure, subject to data availability and comparability.
Adults with Disability Living in Poverty Census Tract: 06033001101
Adults with Disability Living in Poverty Census Tract: 06033001101
10.5%
(2018-2022)
Compared to:
CA Census Tracts
The distribution is based on data from 8,997 California census tracts.
U.S. Census Tracts
The distribution is based on data from 82,173 U.S. census tracts.
Lake, CA County Value
(31.8%)
The regional value is compared to the Lake County value.
Adults with Disability Living in Poverty Census Tract: 06033001102
Adults with Disability Living in Poverty Census Tract: 06033001102
33.8%
(2018-2022)
Compared to:
CA Census Tracts
The distribution is based on data from 8,997 California census tracts.
U.S. Census Tracts
The distribution is based on data from 82,173 U.S. census tracts.
Lake, CA County Value
(31.8%)
The regional value is compared to the Lake County value.
Adults with Disability Living in Poverty Census Tract: 06033001200
Adults with Disability Living in Poverty Census Tract: 06033001200
64.0%
(2018-2022)
Compared to:
CA Census Tracts
The distribution is based on data from 8,997 California census tracts.
U.S. Census Tracts
The distribution is based on data from 82,173 U.S. census tracts.
Lake, CA County Value
(31.8%)
The regional value is compared to the Lake County value.
Trend
This comparison measures the indicator’s values over multiple time periods.<br>The Mann-Kendall Test for Statistical Significance is used to evaluate the trend<br>over 4 to 10 periods of measure, subject to data availability and comparability.
Adults with Disability Living in Poverty Census Tract: 06033001300
Adults with Disability Living in Poverty Census Tract: 06033001300
6.4%
(2015-2019)
Compared to:
CA Census Tracts
The distribution is based on data from 7,965 California census tracts.
U.S. Census Tracts
The distribution is based on data from 72,077 U.S. census tracts.
Lake, CA County Value
(31.2%)
The regional value is compared to the Lake County value.
Trend
This comparison measures the indicator’s values over multiple time periods.<br>The Mann-Kendall Test for Statistical Significance is used to evaluate the trend<br>over 4 to 10 periods of measure, subject to data availability and comparability.
Adults with Disability Living in Poverty Census Tract: 06033001301
Adults with Disability Living in Poverty Census Tract: 06033001301
19.5%
(2018-2022)
Compared to:
CA Census Tracts
The distribution is based on data from 8,997 California census tracts.
U.S. Census Tracts
The distribution is based on data from 82,173 U.S. census tracts.
Lake, CA County Value
(31.8%)
The regional value is compared to the Lake County value.
Adults with Disability Living in Poverty Census Tract: 06033001302
Adults with Disability Living in Poverty Census Tract: 06033001302
10.2%
(2018-2022)
Compared to:
CA Census Tracts
The distribution is based on data from 8,997 California census tracts.
U.S. Census Tracts
The distribution is based on data from 82,173 U.S. census tracts.
Lake, CA County Value
(31.8%)
The regional value is compared to the Lake County value.
Health / Older Adults
Elder Index (Elderly Household Below Income Threshold) County: Lake
Elder Index (Elderly Household Below Income Threshold) County: Lake
37.1%
(2019-2020)
Compared to:
CA Counties
The distribution is based on data from 58 California counties.
CA Value
(27.7%)
The regional value is compared to the California state value.
Prior Value
(36.8%)
Prior Value compares a measured value with the previously measured value. Confidence intervals were taken into account in determining the direction of the comparison.
Trend
This comparison measures the indicator’s values over multiple time periods.<br>The Mann-Kendall Test for Statistical Significance is used to evaluate the trend<br>over 4 to 10 periods of measure, subject to data availability and comparability.
Economy / Food Insecurity
Households Receiving SNAP with Children County: Lake
Households Receiving SNAP with Children County: Lake
42.9%
(2018-2022)
Compared to:


CA Value
(53.1%)
The regional value is compared to the California state value.
US Value
(47.9%)
The regional value is compared to the national value.
Trend
This comparison measures the indicator’s values over multiple time periods.<br>The Mann-Kendall Test for Statistical Significance is used to evaluate the trend<br>over 4 to 10 periods of measure, subject to data availability and comparability.
Households Receiving SNAP with Children Census Place: Clearlake
Households Receiving SNAP with Children Census Place: Clearlake
45.1%
(2018-2022)
Compared to:

Lake, CA County Value
(42.9%)
The regional value is compared to the Lake County value.
CA Value
(53.1%)
The regional value is compared to the California state value.
US Value
(47.9%)
The regional value is compared to the national value.
Trend
This comparison measures the indicator’s values over multiple time periods.<br>The Mann-Kendall Test for Statistical Significance is used to evaluate the trend<br>over 4 to 10 periods of measure, subject to data availability and comparability.
Households Receiving SNAP with Children Census Place: Clearlake Oaks
Households Receiving SNAP with Children Census Place: Clearlake Oaks
42.4%
(2018-2022)
Compared to:

Lake, CA County Value
(42.9%)
The regional value is compared to the Lake County value.
CA Value
(53.1%)
The regional value is compared to the California state value.
US Value
(47.9%)
The regional value is compared to the national value.
Trend
This comparison measures the indicator’s values over multiple time periods.<br>The Mann-Kendall Test for Statistical Significance is used to evaluate the trend<br>over 4 to 10 periods of measure, subject to data availability and comparability.
Households Receiving SNAP with Children Census Place: Clearlake Riviera
Households Receiving SNAP with Children Census Place: Clearlake Riviera
31.3%
(2018-2022)
Compared to:
Lake, CA County Value
(42.9%)
The regional value is compared to the Lake County value.
CA Value
(53.1%)
The regional value is compared to the California state value.
US Value
(47.9%)
The regional value is compared to the national value.
Trend
This comparison measures the indicator’s values over multiple time periods.<br>The Mann-Kendall Test for Statistical Significance is used to evaluate the trend<br>over 4 to 10 periods of measure, subject to data availability and comparability.
Households Receiving SNAP with Children Census Place: Cobb
Households Receiving SNAP with Children Census Place: Cobb
42.9%
(2018-2022)
Compared to:

Lake, CA County Value
(42.9%)
The regional value is compared to the Lake County value.
CA Value
(53.1%)
The regional value is compared to the California state value.
US Value
(47.9%)
The regional value is compared to the national value.
Trend
This comparison measures the indicator’s values over multiple time periods.<br>The Mann-Kendall Test for Statistical Significance is used to evaluate the trend<br>over 4 to 10 periods of measure, subject to data availability and comparability.
Households Receiving SNAP with Children Census Place: Hidden Valley Lake
Households Receiving SNAP with Children Census Place: Hidden Valley Lake
20.1%
(2018-2022)
Compared to:
Lake, CA County Value
(42.9%)
The regional value is compared to the Lake County value.
CA Value
(53.1%)
The regional value is compared to the California state value.
US Value
(47.9%)
The regional value is compared to the national value.
Trend
This comparison measures the indicator’s values over multiple time periods.<br>The Mann-Kendall Test for Statistical Significance is used to evaluate the trend<br>over 4 to 10 periods of measure, subject to data availability and comparability.
Households Receiving SNAP with Children Census Place: Kelseyville
Households Receiving SNAP with Children Census Place: Kelseyville
49.7%
(2018-2022)
Compared to:
Lake, CA County Value
(42.9%)
The regional value is compared to the Lake County value.
CA Value
(53.1%)
The regional value is compared to the California state value.
US Value
(47.9%)
The regional value is compared to the national value.
Trend
This comparison measures the indicator’s values over multiple time periods.<br>The Mann-Kendall Test for Statistical Significance is used to evaluate the trend<br>over 4 to 10 periods of measure, subject to data availability and comparability.
Households Receiving SNAP with Children Census Place: Lakeport
Households Receiving SNAP with Children Census Place: Lakeport
28.0%
(2018-2022)
Compared to:
Lake, CA County Value
(42.9%)
The regional value is compared to the Lake County value.
CA Value
(53.1%)
The regional value is compared to the California state value.
US Value
(47.9%)
The regional value is compared to the national value.
Trend
This comparison measures the indicator’s values over multiple time periods.<br>The Mann-Kendall Test for Statistical Significance is used to evaluate the trend<br>over 4 to 10 periods of measure, subject to data availability and comparability.
Households Receiving SNAP with Children Census Place: Lower Lake
Households Receiving SNAP with Children Census Place: Lower Lake
100.0%
(2018-2022)
Compared to:

Lake, CA County Value
(42.9%)
The regional value is compared to the Lake County value.
CA Value
(53.1%)
The regional value is compared to the California state value.
US Value
(47.9%)
The regional value is compared to the national value.
Trend
This comparison measures the indicator’s values over multiple time periods.<br>The Mann-Kendall Test for Statistical Significance is used to evaluate the trend<br>over 4 to 10 periods of measure, subject to data availability and comparability.
Households Receiving SNAP with Children Census Place: Lucerne
Households Receiving SNAP with Children Census Place: Lucerne
24.8%
(2018-2022)
Compared to:
Lake, CA County Value
(42.9%)
The regional value is compared to the Lake County value.
CA Value
(53.1%)
The regional value is compared to the California state value.
US Value
(47.9%)
The regional value is compared to the national value.
Trend
This comparison measures the indicator’s values over multiple time periods.<br>The Mann-Kendall Test for Statistical Significance is used to evaluate the trend<br>over 4 to 10 periods of measure, subject to data availability and comparability.
Households Receiving SNAP with Children Census Place: Middletown
Households Receiving SNAP with Children Census Place: Middletown
64.7%
(2018-2022)
Compared to:
Lake, CA County Value
(42.9%)
The regional value is compared to the Lake County value.
CA Value
(53.1%)
The regional value is compared to the California state value.
US Value
(47.9%)
The regional value is compared to the national value.
Trend
This comparison measures the indicator’s values over multiple time periods.<br>The Mann-Kendall Test for Statistical Significance is used to evaluate the trend<br>over 4 to 10 periods of measure, subject to data availability and comparability.
Households Receiving SNAP with Children Census Place: Nice
Households Receiving SNAP with Children Census Place: Nice
19.9%
(2018-2022)
Compared to:
Lake, CA County Value
(42.9%)
The regional value is compared to the Lake County value.
CA Value
(53.1%)
The regional value is compared to the California state value.
US Value
(47.9%)
The regional value is compared to the national value.
Trend
This comparison measures the indicator’s values over multiple time periods.<br>The Mann-Kendall Test for Statistical Significance is used to evaluate the trend<br>over 4 to 10 periods of measure, subject to data availability and comparability.
Households Receiving SNAP with Children Census Place: North Lakeport
Households Receiving SNAP with Children Census Place: North Lakeport
66.3%
(2018-2022)
Compared to:
Lake, CA County Value
(42.9%)
The regional value is compared to the Lake County value.
CA Value
(53.1%)
The regional value is compared to the California state value.
US Value
(47.9%)
The regional value is compared to the national value.
Trend
This comparison measures the indicator’s values over multiple time periods.<br>The Mann-Kendall Test for Statistical Significance is used to evaluate the trend<br>over 4 to 10 periods of measure, subject to data availability and comparability.
Households Receiving SNAP with Children Census Place: Soda Bay
Households Receiving SNAP with Children Census Place: Soda Bay
0.0%
(2018-2022)
Compared to:
Lake, CA County Value
(42.9%)
The regional value is compared to the Lake County value.
CA Value
(53.1%)
The regional value is compared to the California state value.
US Value
(47.9%)
The regional value is compared to the national value.
Trend
This comparison measures the indicator’s values over multiple time periods.<br>The Mann-Kendall Test for Statistical Significance is used to evaluate the trend<br>over 4 to 10 periods of measure, subject to data availability and comparability.
Households Receiving SNAP with Children Census Place: Spring Valley
Households Receiving SNAP with Children Census Place: Spring Valley
0.0%
(2018-2022)
Compared to:
Lake, CA County Value
(42.9%)
The regional value is compared to the Lake County value.
CA Value
(53.1%)
The regional value is compared to the California state value.
US Value
(47.9%)
The regional value is compared to the national value.
Trend
This comparison measures the indicator’s values over multiple time periods.<br>The Mann-Kendall Test for Statistical Significance is used to evaluate the trend<br>over 4 to 10 periods of measure, subject to data availability and comparability.
Households Receiving SNAP with Children Census Place: Upper Lake
Households Receiving SNAP with Children Census Place: Upper Lake
48.3%
(2018-2022)
Compared to:
Lake, CA County Value
(42.9%)
The regional value is compared to the Lake County value.
CA Value
(53.1%)
The regional value is compared to the California state value.
US Value
(47.9%)
The regional value is compared to the national value.
Trend
This comparison measures the indicator’s values over multiple time periods.<br>The Mann-Kendall Test for Statistical Significance is used to evaluate the trend<br>over 4 to 10 periods of measure, subject to data availability and comparability.
Households Receiving SNAP with Children Zip Code: 95422
Households Receiving SNAP with Children Zip Code: 95422
45.1%
(2018-2022)
Compared to:
Lake, CA County Value
(42.9%)
The regional value is compared to the Lake County value.
Trend
This comparison measures the indicator’s values over multiple time periods.<br>The Mann-Kendall Test for Statistical Significance is used to evaluate the trend<br>over 4 to 10 periods of measure, subject to data availability and comparability.
Households Receiving SNAP with Children Zip Code: 95423
Households Receiving SNAP with Children Zip Code: 95423
41.9%
(2018-2022)
Compared to:
Lake, CA County Value
(42.9%)
The regional value is compared to the Lake County value.
Trend
This comparison measures the indicator’s values over multiple time periods.<br>The Mann-Kendall Test for Statistical Significance is used to evaluate the trend<br>over 4 to 10 periods of measure, subject to data availability and comparability.
Households Receiving SNAP with Children Zip Code: 95426
Households Receiving SNAP with Children Zip Code: 95426
51.9%
(2018-2022)
Compared to:
Lake, CA County Value
(42.9%)
The regional value is compared to the Lake County value.
Trend
This comparison measures the indicator’s values over multiple time periods.<br>The Mann-Kendall Test for Statistical Significance is used to evaluate the trend<br>over 4 to 10 periods of measure, subject to data availability and comparability.
Households Receiving SNAP with Children Zip Code: 95435
Households Receiving SNAP with Children Zip Code: 95435
0.0%
(2017-2021)
Compared to:
Lake, CA County Value
(41.9%)
The regional value is compared to the Lake County value.
Trend
This comparison measures the indicator’s values over multiple time periods.<br>The Mann-Kendall Test for Statistical Significance is used to evaluate the trend<br>over 4 to 10 periods of measure, subject to data availability and comparability.
Households Receiving SNAP with Children Zip Code: 95443
Households Receiving SNAP with Children Zip Code: 95443
100.0%
(2018-2022)
Compared to:
Lake, CA County Value
(42.9%)
The regional value is compared to the Lake County value.
Trend
This comparison measures the indicator’s values over multiple time periods.<br>The Mann-Kendall Test for Statistical Significance is used to evaluate the trend<br>over 4 to 10 periods of measure, subject to data availability and comparability.
Households Receiving SNAP with Children Zip Code: 95451
Households Receiving SNAP with Children Zip Code: 95451
47.1%
(2018-2022)
Compared to:
Lake, CA County Value
(42.9%)
The regional value is compared to the Lake County value.
Trend
This comparison measures the indicator’s values over multiple time periods.<br>The Mann-Kendall Test for Statistical Significance is used to evaluate the trend<br>over 4 to 10 periods of measure, subject to data availability and comparability.
Households Receiving SNAP with Children Zip Code: 95453
Households Receiving SNAP with Children Zip Code: 95453
44.8%
(2018-2022)
Compared to:
Lake, CA County Value
(42.9%)
The regional value is compared to the Lake County value.
Trend
This comparison measures the indicator’s values over multiple time periods.<br>The Mann-Kendall Test for Statistical Significance is used to evaluate the trend<br>over 4 to 10 periods of measure, subject to data availability and comparability.
Households Receiving SNAP with Children Zip Code: 95457
Households Receiving SNAP with Children Zip Code: 95457
54.0%
(2018-2022)
Compared to:
Lake, CA County Value
(42.9%)
The regional value is compared to the Lake County value.
Trend
This comparison measures the indicator’s values over multiple time periods.<br>The Mann-Kendall Test for Statistical Significance is used to evaluate the trend<br>over 4 to 10 periods of measure, subject to data availability and comparability.
Households Receiving SNAP with Children Zip Code: 95458
Households Receiving SNAP with Children Zip Code: 95458
23.2%
(2018-2022)
Compared to:
Lake, CA County Value
(42.9%)
The regional value is compared to the Lake County value.
Trend
This comparison measures the indicator’s values over multiple time periods.<br>The Mann-Kendall Test for Statistical Significance is used to evaluate the trend<br>over 4 to 10 periods of measure, subject to data availability and comparability.
Households Receiving SNAP with Children Zip Code: 95461
Households Receiving SNAP with Children Zip Code: 95461
55.7%
(2018-2022)
Compared to:
Lake, CA County Value
(42.9%)
The regional value is compared to the Lake County value.
Trend
This comparison measures the indicator’s values over multiple time periods.<br>The Mann-Kendall Test for Statistical Significance is used to evaluate the trend<br>over 4 to 10 periods of measure, subject to data availability and comparability.
Households Receiving SNAP with Children Zip Code: 95464
Households Receiving SNAP with Children Zip Code: 95464
33.1%
(2018-2022)
Compared to:
Lake, CA County Value
(42.9%)
The regional value is compared to the Lake County value.
Trend
This comparison measures the indicator’s values over multiple time periods.<br>The Mann-Kendall Test for Statistical Significance is used to evaluate the trend<br>over 4 to 10 periods of measure, subject to data availability and comparability.
Households Receiving SNAP with Children Zip Code: 95467
Households Receiving SNAP with Children Zip Code: 95467
21.2%
(2018-2022)
Compared to:
Lake, CA County Value
(42.9%)
The regional value is compared to the Lake County value.
Trend
This comparison measures the indicator’s values over multiple time periods.<br>The Mann-Kendall Test for Statistical Significance is used to evaluate the trend<br>over 4 to 10 periods of measure, subject to data availability and comparability.
Households Receiving SNAP with Children Zip Code: 95485
Households Receiving SNAP with Children Zip Code: 95485
38.1%
(2018-2022)
Compared to:
Lake, CA County Value
(42.9%)
The regional value is compared to the Lake County value.
Trend
This comparison measures the indicator’s values over multiple time periods.<br>The Mann-Kendall Test for Statistical Significance is used to evaluate the trend<br>over 4 to 10 periods of measure, subject to data availability and comparability.
Households Receiving SNAP with Children Zip Code: 95493
Households Receiving SNAP with Children Zip Code: 95493
0.0%
(2018-2022)
Compared to:
Lake, CA County Value
(42.9%)
The regional value is compared to the Lake County value.
Households Receiving SNAP with Children Census Tract: 06033000100
Households Receiving SNAP with Children Census Tract: 06033000100
44.1%
(2018-2022)
Compared to:
Lake, CA County Value
(42.9%)
The regional value is compared to the Lake County value.
Trend
This comparison measures the indicator’s values over multiple time periods.<br>The Mann-Kendall Test for Statistical Significance is used to evaluate the trend<br>over 4 to 10 periods of measure, subject to data availability and comparability.
Households Receiving SNAP with Children Census Tract: 06033000300
Households Receiving SNAP with Children Census Tract: 06033000300
73.8%
(2018-2022)
Compared to:
Lake, CA County Value
(42.9%)
The regional value is compared to the Lake County value.
Trend
This comparison measures the indicator’s values over multiple time periods.<br>The Mann-Kendall Test for Statistical Significance is used to evaluate the trend<br>over 4 to 10 periods of measure, subject to data availability and comparability.
Households Receiving SNAP with Children Census Tract: 06033000400
Households Receiving SNAP with Children Census Tract: 06033000400
45.8%
(2015-2019)
Compared to:
Lake, CA County Value
(49.4%)
The regional value is compared to the Lake County value.
Trend
This comparison measures the indicator’s values over multiple time periods.<br>The Mann-Kendall Test for Statistical Significance is used to evaluate the trend<br>over 4 to 10 periods of measure, subject to data availability and comparability.
Households Receiving SNAP with Children Census Tract: 06033000401
Households Receiving SNAP with Children Census Tract: 06033000401
66.2%
(2018-2022)
Compared to:
Lake, CA County Value
(42.9%)
The regional value is compared to the Lake County value.
Households Receiving SNAP with Children Census Tract: 06033000402
Households Receiving SNAP with Children Census Tract: 06033000402
20.3%
(2018-2022)
Compared to:
Lake, CA County Value
(42.9%)
The regional value is compared to the Lake County value.
Households Receiving SNAP with Children Census Tract: 06033000501
Households Receiving SNAP with Children Census Tract: 06033000501
20.8%
(2018-2022)
Compared to:
Lake, CA County Value
(42.9%)
The regional value is compared to the Lake County value.
Trend
This comparison measures the indicator’s values over multiple time periods.<br>The Mann-Kendall Test for Statistical Significance is used to evaluate the trend<br>over 4 to 10 periods of measure, subject to data availability and comparability.
Households Receiving SNAP with Children Census Tract: 06033000502
Households Receiving SNAP with Children Census Tract: 06033000502
20.8%
(2018-2022)
Compared to:
Lake, CA County Value
(42.9%)
The regional value is compared to the Lake County value.
Trend
This comparison measures the indicator’s values over multiple time periods.<br>The Mann-Kendall Test for Statistical Significance is used to evaluate the trend<br>over 4 to 10 periods of measure, subject to data availability and comparability.
Households Receiving SNAP with Children Census Tract: 06033000600
Households Receiving SNAP with Children Census Tract: 06033000600
43.3%
(2015-2019)
Compared to:
Lake, CA County Value
(49.4%)
The regional value is compared to the Lake County value.
Trend
This comparison measures the indicator’s values over multiple time periods.<br>The Mann-Kendall Test for Statistical Significance is used to evaluate the trend<br>over 4 to 10 periods of measure, subject to data availability and comparability.
Households Receiving SNAP with Children Census Tract: 06033000601
Households Receiving SNAP with Children Census Tract: 06033000601
41.8%
(2018-2022)
Compared to:
Lake, CA County Value
(42.9%)
The regional value is compared to the Lake County value.
Households Receiving SNAP with Children Census Tract: 06033000602
Households Receiving SNAP with Children Census Tract: 06033000602
58.0%
(2018-2022)
Compared to:
Lake, CA County Value
(42.9%)
The regional value is compared to the Lake County value.
Households Receiving SNAP with Children Census Tract: 06033000701
Households Receiving SNAP with Children Census Tract: 06033000701
40.1%
(2015-2019)
Compared to:
Lake, CA County Value
(49.4%)
The regional value is compared to the Lake County value.
Trend
This comparison measures the indicator’s values over multiple time periods.<br>The Mann-Kendall Test for Statistical Significance is used to evaluate the trend<br>over 4 to 10 periods of measure, subject to data availability and comparability.
Households Receiving SNAP with Children Census Tract: 06033000702
Households Receiving SNAP with Children Census Tract: 06033000702
52.3%
(2018-2022)
Compared to:
Lake, CA County Value
(42.9%)
The regional value is compared to the Lake County value.
Trend
This comparison measures the indicator’s values over multiple time periods.<br>The Mann-Kendall Test for Statistical Significance is used to evaluate the trend<br>over 4 to 10 periods of measure, subject to data availability and comparability.
Households Receiving SNAP with Children Census Tract: 06033000703
Households Receiving SNAP with Children Census Tract: 06033000703
27.4%
(2018-2022)
Compared to:
Lake, CA County Value
(42.9%)
The regional value is compared to the Lake County value.
Households Receiving SNAP with Children Census Tract: 06033000704
Households Receiving SNAP with Children Census Tract: 06033000704
68.6%
(2018-2022)
Compared to:
Lake, CA County Value
(42.9%)
The regional value is compared to the Lake County value.
Households Receiving SNAP with Children Census Tract: 06033000801
Households Receiving SNAP with Children Census Tract: 06033000801
42.7%
(2018-2022)
Compared to:
Lake, CA County Value
(42.9%)
The regional value is compared to the Lake County value.
Trend
This comparison measures the indicator’s values over multiple time periods.<br>The Mann-Kendall Test for Statistical Significance is used to evaluate the trend<br>over 4 to 10 periods of measure, subject to data availability and comparability.
Households Receiving SNAP with Children Census Tract: 06033000802
Households Receiving SNAP with Children Census Tract: 06033000802
39.2%
(2018-2022)
Compared to:
Lake, CA County Value
(42.9%)
The regional value is compared to the Lake County value.
Trend
This comparison measures the indicator’s values over multiple time periods.<br>The Mann-Kendall Test for Statistical Significance is used to evaluate the trend<br>over 4 to 10 periods of measure, subject to data availability and comparability.
Households Receiving SNAP with Children Census Tract: 06033000900
Households Receiving SNAP with Children Census Tract: 06033000900
57.7%
(2015-2019)
Compared to:
Lake, CA County Value
(49.4%)
The regional value is compared to the Lake County value.
Trend
This comparison measures the indicator’s values over multiple time periods.<br>The Mann-Kendall Test for Statistical Significance is used to evaluate the trend<br>over 4 to 10 periods of measure, subject to data availability and comparability.
Households Receiving SNAP with Children Census Tract: 06033000901
Households Receiving SNAP with Children Census Tract: 06033000901
9.4%
(2018-2022)
Compared to:
Lake, CA County Value
(42.9%)
The regional value is compared to the Lake County value.
Households Receiving SNAP with Children Census Tract: 06033000902
Households Receiving SNAP with Children Census Tract: 06033000902
26.0%
(2018-2022)
Compared to:
Lake, CA County Value
(42.9%)
The regional value is compared to the Lake County value.
Households Receiving SNAP with Children Census Tract: 06033001000
Households Receiving SNAP with Children Census Tract: 06033001000
55.9%
(2018-2022)
Compared to:
Lake, CA County Value
(42.9%)
The regional value is compared to the Lake County value.
Trend
This comparison measures the indicator’s values over multiple time periods.<br>The Mann-Kendall Test for Statistical Significance is used to evaluate the trend<br>over 4 to 10 periods of measure, subject to data availability and comparability.
Households Receiving SNAP with Children Census Tract: 06033001100
Households Receiving SNAP with Children Census Tract: 06033001100
11.7%
(2015-2019)
Compared to:
Lake, CA County Value
(49.4%)
The regional value is compared to the Lake County value.
Trend
This comparison measures the indicator’s values over multiple time periods.<br>The Mann-Kendall Test for Statistical Significance is used to evaluate the trend<br>over 4 to 10 periods of measure, subject to data availability and comparability.
Households Receiving SNAP with Children Census Tract: 06033001101
Households Receiving SNAP with Children Census Tract: 06033001101
52.1%
(2018-2022)
Compared to:
Lake, CA County Value
(42.9%)
The regional value is compared to the Lake County value.
Households Receiving SNAP with Children Census Tract: 06033001102
Households Receiving SNAP with Children Census Tract: 06033001102
26.1%
(2018-2022)
Compared to:
Lake, CA County Value
(42.9%)
The regional value is compared to the Lake County value.
Households Receiving SNAP with Children Census Tract: 06033001200
Households Receiving SNAP with Children Census Tract: 06033001200
51.9%
(2018-2022)
Compared to:
Lake, CA County Value
(42.9%)
The regional value is compared to the Lake County value.
Trend
This comparison measures the indicator’s values over multiple time periods.<br>The Mann-Kendall Test for Statistical Significance is used to evaluate the trend<br>over 4 to 10 periods of measure, subject to data availability and comparability.
Households Receiving SNAP with Children Census Tract: 06033001300
Households Receiving SNAP with Children Census Tract: 06033001300
38.0%
(2015-2019)
Compared to:
Lake, CA County Value
(49.4%)
The regional value is compared to the Lake County value.
Trend
This comparison measures the indicator’s values over multiple time periods.<br>The Mann-Kendall Test for Statistical Significance is used to evaluate the trend<br>over 4 to 10 periods of measure, subject to data availability and comparability.
Households Receiving SNAP with Children Census Tract: 06033001301
Households Receiving SNAP with Children Census Tract: 06033001301
20.3%
(2018-2022)
Compared to:
Lake, CA County Value
(42.9%)
The regional value is compared to the Lake County value.
Households Receiving SNAP with Children Census Tract: 06033001302
Households Receiving SNAP with Children Census Tract: 06033001302
59.5%
(2018-2022)
Compared to:
Lake, CA County Value
(42.9%)
The regional value is compared to the Lake County value.
Households Receiving SNAP with Children (Count) County: Lake
Households Receiving SNAP with Children (Count) County: Lake
2,082
Households
(2018-2022)
Compared to:
Trend
This comparison measures the indicator’s values over multiple time periods.<br>The Mann-Kendall Test for Statistical Significance is used to evaluate the trend<br>over 4 to 10 periods of measure, subject to data availability and comparability.
Households Receiving SNAP with Children (Count) Zip Code: 95422
Households Receiving SNAP with Children (Count) Zip Code: 95422
814
Households
(2018-2022)
Compared to:
Trend
This comparison measures the indicator’s values over multiple time periods.<br>The Mann-Kendall Test for Statistical Significance is used to evaluate the trend<br>over 4 to 10 periods of measure, subject to data availability and comparability.
Households Receiving SNAP with Children (Count) Zip Code: 95423
Households Receiving SNAP with Children (Count) Zip Code: 95423
150
Households
(2018-2022)
Compared to:
Trend
This comparison measures the indicator’s values over multiple time periods.<br>The Mann-Kendall Test for Statistical Significance is used to evaluate the trend<br>over 4 to 10 periods of measure, subject to data availability and comparability.
Households Receiving SNAP with Children (Count) Zip Code: 95426
Households Receiving SNAP with Children (Count) Zip Code: 95426
55
Households
(2018-2022)
Compared to:
Trend
This comparison measures the indicator’s values over multiple time periods.<br>The Mann-Kendall Test for Statistical Significance is used to evaluate the trend<br>over 4 to 10 periods of measure, subject to data availability and comparability.
Households Receiving SNAP with Children (Count) Zip Code: 95435
Households Receiving SNAP with Children (Count) Zip Code: 95435
0
Households
(2017-2021)
Compared to:
Trend
This comparison measures the indicator’s values over multiple time periods.<br>The Mann-Kendall Test for Statistical Significance is used to evaluate the trend<br>over 4 to 10 periods of measure, subject to data availability and comparability.
Households Receiving SNAP with Children (Count) Zip Code: 95443
Households Receiving SNAP with Children (Count) Zip Code: 95443
30
Households
(2018-2022)
Compared to:
Trend
This comparison measures the indicator’s values over multiple time periods.<br>The Mann-Kendall Test for Statistical Significance is used to evaluate the trend<br>over 4 to 10 periods of measure, subject to data availability and comparability.
Households Receiving SNAP with Children (Count) Zip Code: 95451
Households Receiving SNAP with Children (Count) Zip Code: 95451
367
Households
(2018-2022)
Compared to:
Trend
This comparison measures the indicator’s values over multiple time periods.<br>The Mann-Kendall Test for Statistical Significance is used to evaluate the trend<br>over 4 to 10 periods of measure, subject to data availability and comparability.
Households Receiving SNAP with Children (Count) Zip Code: 95453
Households Receiving SNAP with Children (Count) Zip Code: 95453
235
Households
(2018-2022)
Compared to:
Trend
This comparison measures the indicator’s values over multiple time periods.<br>The Mann-Kendall Test for Statistical Significance is used to evaluate the trend<br>over 4 to 10 periods of measure, subject to data availability and comparability.
Households Receiving SNAP with Children (Count) Zip Code: 95457
Households Receiving SNAP with Children (Count) Zip Code: 95457
75
Households
(2018-2022)
Compared to:
Trend
This comparison measures the indicator’s values over multiple time periods.<br>The Mann-Kendall Test for Statistical Significance is used to evaluate the trend<br>over 4 to 10 periods of measure, subject to data availability and comparability.
Households Receiving SNAP with Children (Count) Zip Code: 95458
Households Receiving SNAP with Children (Count) Zip Code: 95458
69
Households
(2018-2022)
Compared to:
Trend
This comparison measures the indicator’s values over multiple time periods.<br>The Mann-Kendall Test for Statistical Significance is used to evaluate the trend<br>over 4 to 10 periods of measure, subject to data availability and comparability.
Households Receiving SNAP with Children (Count) Zip Code: 95461
Households Receiving SNAP with Children (Count) Zip Code: 95461
88
Households
(2018-2022)
Compared to:
Trend
This comparison measures the indicator’s values over multiple time periods.<br>The Mann-Kendall Test for Statistical Significance is used to evaluate the trend<br>over 4 to 10 periods of measure, subject to data availability and comparability.
Households Receiving SNAP with Children (Count) Zip Code: 95464
Households Receiving SNAP with Children (Count) Zip Code: 95464
55
Households
(2018-2022)
Compared to:
Trend
This comparison measures the indicator’s values over multiple time periods.<br>The Mann-Kendall Test for Statistical Significance is used to evaluate the trend<br>over 4 to 10 periods of measure, subject to data availability and comparability.
Households Receiving SNAP with Children (Count) Zip Code: 95467
Households Receiving SNAP with Children (Count) Zip Code: 95467
45
Households
(2018-2022)
Compared to:
Trend
This comparison measures the indicator’s values over multiple time periods.<br>The Mann-Kendall Test for Statistical Significance is used to evaluate the trend<br>over 4 to 10 periods of measure, subject to data availability and comparability.
Households Receiving SNAP with Children (Count) Zip Code: 95485
Households Receiving SNAP with Children (Count) Zip Code: 95485
99
Households
(2018-2022)
Compared to:
Trend
This comparison measures the indicator’s values over multiple time periods.<br>The Mann-Kendall Test for Statistical Significance is used to evaluate the trend<br>over 4 to 10 periods of measure, subject to data availability and comparability.
Households Receiving SNAP with Children (Count) Zip Code: 95493
Households Receiving SNAP with Children (Count) Zip Code: 95493
0
Households
(2018-2022)
Compared to:
Trend
This comparison measures the indicator’s values over multiple time periods.<br>The Mann-Kendall Test for Statistical Significance is used to evaluate the trend<br>over 4 to 10 periods of measure, subject to data availability and comparability.
Households Receiving SNAP with Children (Count) Census Tract: 06033000100
Households Receiving SNAP with Children (Count) Census Tract: 06033000100
112
Households
(2018-2022)
Compared to:
Trend
This comparison measures the indicator’s values over multiple time periods.<br>The Mann-Kendall Test for Statistical Significance is used to evaluate the trend<br>over 4 to 10 periods of measure, subject to data availability and comparability.
Households Receiving SNAP with Children (Count) Census Tract: 06033000300
Households Receiving SNAP with Children (Count) Census Tract: 06033000300
124
Households
(2018-2022)
Compared to:
Trend
This comparison measures the indicator’s values over multiple time periods.<br>The Mann-Kendall Test for Statistical Significance is used to evaluate the trend<br>over 4 to 10 periods of measure, subject to data availability and comparability.
Households Receiving SNAP with Children (Count) Census Tract: 06033000501
Households Receiving SNAP with Children (Count) Census Tract: 06033000501
57
Households
(2018-2022)
Compared to:
Trend
This comparison measures the indicator’s values over multiple time periods.<br>The Mann-Kendall Test for Statistical Significance is used to evaluate the trend<br>over 4 to 10 periods of measure, subject to data availability and comparability.
Households Receiving SNAP with Children (Count) Census Tract: 06033000502
Households Receiving SNAP with Children (Count) Census Tract: 06033000502
42
Households
(2018-2022)
Compared to:
Trend
This comparison measures the indicator’s values over multiple time periods.<br>The Mann-Kendall Test for Statistical Significance is used to evaluate the trend<br>over 4 to 10 periods of measure, subject to data availability and comparability.
Households Receiving SNAP with Children (Count) Census Tract: 06033000702
Households Receiving SNAP with Children (Count) Census Tract: 06033000702
229
Households
(2018-2022)
Compared to:
Trend
This comparison measures the indicator’s values over multiple time periods.<br>The Mann-Kendall Test for Statistical Significance is used to evaluate the trend<br>over 4 to 10 periods of measure, subject to data availability and comparability.
Households Receiving SNAP with Children (Count) Census Tract: 06033000801
Households Receiving SNAP with Children (Count) Census Tract: 06033000801
160
Households
(2018-2022)
Compared to:
Trend
This comparison measures the indicator’s values over multiple time periods.<br>The Mann-Kendall Test for Statistical Significance is used to evaluate the trend<br>over 4 to 10 periods of measure, subject to data availability and comparability.
Households Receiving SNAP with Children (Count) Census Tract: 06033000802
Households Receiving SNAP with Children (Count) Census Tract: 06033000802
244
Households
(2018-2022)
Compared to:
Trend
This comparison measures the indicator’s values over multiple time periods.<br>The Mann-Kendall Test for Statistical Significance is used to evaluate the trend<br>over 4 to 10 periods of measure, subject to data availability and comparability.
Households Receiving SNAP with Children (Count) Census Tract: 06033001000
Households Receiving SNAP with Children (Count) Census Tract: 06033001000
358
Households
(2018-2022)
Compared to:
Trend
This comparison measures the indicator’s values over multiple time periods.<br>The Mann-Kendall Test for Statistical Significance is used to evaluate the trend<br>over 4 to 10 periods of measure, subject to data availability and comparability.
Households Receiving SNAP with Children (Count) Census Tract: 06033001200
Households Receiving SNAP with Children (Count) Census Tract: 06033001200
80
Households
(2018-2022)
Compared to:
Trend
This comparison measures the indicator’s values over multiple time periods.<br>The Mann-Kendall Test for Statistical Significance is used to evaluate the trend<br>over 4 to 10 periods of measure, subject to data availability and comparability.
Economy / Housing & Homes
Economy / Housing & Homes
Renters Spending 30% or More of Household Income on Rent
Value
Compared to:
Renters Spending 30% or More of Household Income on Rent County: Lake
Renters Spending 30% or More of Household Income on Rent County: Lake
52.7%
(2018-2022)
Compared to:
CA Counties
The distribution is based on data from 58 California counties.
U.S. Counties
The distribution is based on data from 3,132 U.S. counties and county equivalents.
CA Value
(54.4%)
The regional value is compared to the California state value.
US Value
(49.9%)
The regional value is compared to the national value.
Trend
This comparison measures the indicator’s values over multiple time periods.<br>The Mann-Kendall Test for Statistical Significance is used to evaluate the trend<br>over 4 to 10 periods of measure, subject to data availability and comparability.
HP 2030 Target
(25.5%)
Renters Spending 30% or More of Household Income on Rent Census Place: Clearlake
Renters Spending 30% or More of Household Income on Rent Census Place: Clearlake
64.4%
(2018-2022)
Compared to:
CA Census Places
The distribution is based on data from 1,360 locales.
U.S. Census Places
The distribution is based on data from 26,241 U.S. Census Places.
Lake, CA County Value
(52.7%)
The regional value is compared to the Lake County value.
CA Value
(54.4%)
The regional value is compared to the California state value.
US Value
(49.9%)
The regional value is compared to the national value.
Trend
This comparison measures the indicator’s values over multiple time periods.<br>The Mann-Kendall Test for Statistical Significance is used to evaluate the trend<br>over 4 to 10 periods of measure, subject to data availability and comparability.
HP 2030 Target
(25.5%)
Renters Spending 30% or More of Household Income on Rent Census Place: Clearlake Oaks
Renters Spending 30% or More of Household Income on Rent Census Place: Clearlake Oaks
63.8%
(2018-2022)
Compared to:
CA Census Places
The distribution is based on data from 1,360 locales.
U.S. Census Places
The distribution is based on data from 26,241 U.S. Census Places.
Lake, CA County Value
(52.7%)
The regional value is compared to the Lake County value.
CA Value
(54.4%)
The regional value is compared to the California state value.
US Value
(49.9%)
The regional value is compared to the national value.
Trend
This comparison measures the indicator’s values over multiple time periods.<br>The Mann-Kendall Test for Statistical Significance is used to evaluate the trend<br>over 4 to 10 periods of measure, subject to data availability and comparability.
HP 2030 Target
(25.5%)
Renters Spending 30% or More of Household Income on Rent Census Place: Clearlake Riviera
Renters Spending 30% or More of Household Income on Rent Census Place: Clearlake Riviera
47.1%
(2018-2022)
Compared to:
CA Census Places
The distribution is based on data from 1,360 locales.
U.S. Census Places
The distribution is based on data from 26,241 U.S. Census Places.
Lake, CA County Value
(52.7%)
The regional value is compared to the Lake County value.
CA Value
(54.4%)
The regional value is compared to the California state value.
US Value
(49.9%)
The regional value is compared to the national value.
Trend
This comparison measures the indicator’s values over multiple time periods.<br>The Mann-Kendall Test for Statistical Significance is used to evaluate the trend<br>over 4 to 10 periods of measure, subject to data availability and comparability.
HP 2030 Target
(25.5%)
Renters Spending 30% or More of Household Income on Rent Census Place: Cobb
Renters Spending 30% or More of Household Income on Rent Census Place: Cobb
37.5%
(2018-2022)
Compared to:
CA Census Places
The distribution is based on data from 1,360 locales.
U.S. Census Places
The distribution is based on data from 26,241 U.S. Census Places.
Lake, CA County Value
(52.7%)
The regional value is compared to the Lake County value.
CA Value
(54.4%)
The regional value is compared to the California state value.
US Value
(49.9%)
The regional value is compared to the national value.
Trend
This comparison measures the indicator’s values over multiple time periods.<br>The Mann-Kendall Test for Statistical Significance is used to evaluate the trend<br>over 4 to 10 periods of measure, subject to data availability and comparability.
HP 2030 Target
(25.5%)
Renters Spending 30% or More of Household Income on Rent Census Place: Hidden Valley Lake
Renters Spending 30% or More of Household Income on Rent Census Place: Hidden Valley Lake
62.5%
(2018-2022)
Compared to:
CA Census Places
The distribution is based on data from 1,360 locales.
U.S. Census Places
The distribution is based on data from 26,241 U.S. Census Places.
Lake, CA County Value
(52.7%)
The regional value is compared to the Lake County value.
CA Value
(54.4%)
The regional value is compared to the California state value.
US Value
(49.9%)
The regional value is compared to the national value.
Trend
This comparison measures the indicator’s values over multiple time periods.<br>The Mann-Kendall Test for Statistical Significance is used to evaluate the trend<br>over 4 to 10 periods of measure, subject to data availability and comparability.
HP 2030 Target
(25.5%)
Renters Spending 30% or More of Household Income on Rent Census Place: Kelseyville
Renters Spending 30% or More of Household Income on Rent Census Place: Kelseyville
40.8%
(2018-2022)
Compared to:
CA Census Places
The distribution is based on data from 1,360 locales.
U.S. Census Places
The distribution is based on data from 26,241 U.S. Census Places.
Lake, CA County Value
(52.7%)
The regional value is compared to the Lake County value.
CA Value
(54.4%)
The regional value is compared to the California state value.
US Value
(49.9%)
The regional value is compared to the national value.
Trend
This comparison measures the indicator’s values over multiple time periods.<br>The Mann-Kendall Test for Statistical Significance is used to evaluate the trend<br>over 4 to 10 periods of measure, subject to data availability and comparability.
HP 2030 Target
(25.5%)
Renters Spending 30% or More of Household Income on Rent Census Place: Lakeport
Renters Spending 30% or More of Household Income on Rent Census Place: Lakeport
21.5%
(2018-2022)
Compared to:
CA Census Places
The distribution is based on data from 1,360 locales.
U.S. Census Places
The distribution is based on data from 26,241 U.S. Census Places.
Lake, CA County Value
(52.7%)
The regional value is compared to the Lake County value.
CA Value
(54.4%)
The regional value is compared to the California state value.
US Value
(49.9%)
The regional value is compared to the national value.
Trend
This comparison measures the indicator’s values over multiple time periods.<br>The Mann-Kendall Test for Statistical Significance is used to evaluate the trend<br>over 4 to 10 periods of measure, subject to data availability and comparability.
HP 2030 Target
(25.5%)
Renters Spending 30% or More of Household Income on Rent Census Place: Lower Lake
Renters Spending 30% or More of Household Income on Rent Census Place: Lower Lake
74.1%
(2018-2022)
Compared to:
CA Census Places
The distribution is based on data from 1,360 locales.
U.S. Census Places
The distribution is based on data from 26,241 U.S. Census Places.
Lake, CA County Value
(52.7%)
The regional value is compared to the Lake County value.
CA Value
(54.4%)
The regional value is compared to the California state value.
US Value
(49.9%)
The regional value is compared to the national value.
Trend
This comparison measures the indicator’s values over multiple time periods.<br>The Mann-Kendall Test for Statistical Significance is used to evaluate the trend<br>over 4 to 10 periods of measure, subject to data availability and comparability.
HP 2030 Target
(25.5%)
Renters Spending 30% or More of Household Income on Rent Census Place: Lucerne
Renters Spending 30% or More of Household Income on Rent Census Place: Lucerne
59.8%
(2018-2022)
Compared to:
CA Census Places
The distribution is based on data from 1,360 locales.
U.S. Census Places
The distribution is based on data from 26,241 U.S. Census Places.
Lake, CA County Value
(52.7%)
The regional value is compared to the Lake County value.
CA Value
(54.4%)
The regional value is compared to the California state value.
US Value
(49.9%)
The regional value is compared to the national value.
Trend
This comparison measures the indicator’s values over multiple time periods.<br>The Mann-Kendall Test for Statistical Significance is used to evaluate the trend<br>over 4 to 10 periods of measure, subject to data availability and comparability.
HP 2030 Target
(25.5%)
Renters Spending 30% or More of Household Income on Rent Census Place: Middletown
Renters Spending 30% or More of Household Income on Rent Census Place: Middletown
17.9%
(2018-2022)
Compared to:
CA Census Places
The distribution is based on data from 1,360 locales.
U.S. Census Places
The distribution is based on data from 26,241 U.S. Census Places.
Lake, CA County Value
(52.7%)
The regional value is compared to the Lake County value.
CA Value
(54.4%)
The regional value is compared to the California state value.
US Value
(49.9%)
The regional value is compared to the national value.
Trend
This comparison measures the indicator’s values over multiple time periods.<br>The Mann-Kendall Test for Statistical Significance is used to evaluate the trend<br>over 4 to 10 periods of measure, subject to data availability and comparability.
HP 2030 Target
(25.5%)
Renters Spending 30% or More of Household Income on Rent Census Place: Nice
Renters Spending 30% or More of Household Income on Rent Census Place: Nice
59.3%
(2018-2022)
Compared to:
CA Census Places
The distribution is based on data from 1,360 locales.
U.S. Census Places
The distribution is based on data from 26,241 U.S. Census Places.
Lake, CA County Value
(52.7%)
The regional value is compared to the Lake County value.
CA Value
(54.4%)
The regional value is compared to the California state value.
US Value
(49.9%)
The regional value is compared to the national value.
Trend
This comparison measures the indicator’s values over multiple time periods.<br>The Mann-Kendall Test for Statistical Significance is used to evaluate the trend<br>over 4 to 10 periods of measure, subject to data availability and comparability.
HP 2030 Target
(25.5%)
