Search for Indicators
Community Engagement and Outreach
Indicator Gauge Icon Legend
Legend Colors
Red is bad, green is good, blue is not statistically different/neutral.
Compared to Distribution
 the value is in the best half of communities.
 the value is in the 2nd worst quarter of communities.
 the value is in the worst quarter of communities.
Compared to Target
 meets target;
  does not meet target.
Compared to a Single Value
 lower than the comparison value;
 higher than the comparison value;
 not statistically different from comparison value.
Trend

 non-significant change over time;
 significant change over time;
  no change over time.
Compared to Prior Value
 higher than the previous measurement period;
 lower than the previous measurement period;
 no statistically different change from previous measurement period.
County: Lake
Economy / Poverty
Value
Compared to:
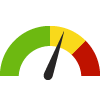
County: Lake Youth not in School or Working
County: Lake Youth not in School or Working
2.2%
(2018-2022)
Compared to:


CA Counties
The distribution is based on data from 58 California counties.
U.S. Counties
The distribution is based on data from 3,130 U.S. counties and county equivalents.
CA Value
(1.5%)
The regional value is compared to the California state value.
US Value
(1.8%)
The regional value is compared to the national value.
Trend
This comparison measures the indicator’s values over multiple time periods.<br>The Mann-Kendall Test for Statistical Significance is used to evaluate the trend<br>over 4 to 10 periods of measure, subject to data availability and comparability.
County: Lake
Education / School Environment
Value
Compared to:
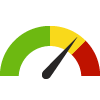
County: Lake Student-to-Teacher Ratio
County: Lake Student-to-Teacher Ratio
20.7
Students per teacher
(2022-2023)
Compared to:

CA Counties
The distribution is based on data from 58 California counties.
U.S. Counties
The distribution is based on data from 3,125 U.S. counties and county equivalents.
CA Value
(21.9)
The regional value is compared to the California state value.
US Value
(15.4)
The regional value is compared to the national value.
Prior Value
(21.3)
Prior Value compares a measured value with the previously measured value. Confidence intervals were not taken into account in determining the direction of the comparison.
Trend
This comparison measures the indicator’s values over multiple time periods.<br>The Mann-Kendall Test for Statistical Significance is used to evaluate the trend<br>over 4 to 10 periods of measure, subject to data availability and comparability.
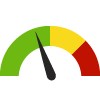
County: Lake
Education / Student Performance K-12
Value
Compared to:
38.0%
(2022)
Compared to:


CA Counties
The distribution is based on data from 57 California counties.
CA Value
(54.8%)
The regional value is compared to the California state value.
Prior Value
(39.8%)
Prior Value compares a measured value with the previously measured value. Confidence intervals were not taken into account in determining the direction of the comparison.
Trend
This comparison measures the indicator’s values over multiple time periods.<br>The Mann-Kendall Test for Statistical Significance is used to evaluate the trend<br>over 4 to 10 periods of measure, subject to data availability and comparability.
County: Lake 11th Grade Students Proficient in Math
County: Lake 11th Grade Students Proficient in Math
6.5%
(2022)
Compared to:
CA Counties
The distribution is based on data from 57 California counties.
CA Value
(27.0%)
The regional value is compared to the California state value.
Prior Value
(8.3%)
Prior Value compares a measured value with the previously measured value. Confidence intervals were not taken into account in determining the direction of the comparison.
Trend
This comparison measures the indicator’s values over multiple time periods.<br>The Mann-Kendall Test for Statistical Significance is used to evaluate the trend<br>over 4 to 10 periods of measure, subject to data availability and comparability.
24%
(2022)
Compared to:

CA Counties
The distribution is based on data from 57 California counties.
CA Value
(42%)
The regional value is compared to the California state value.
Prior Value
(23%)
Prior Value compares a measured value with the previously measured value. Confidence intervals were not taken into account in determining the direction of the comparison.
Trend
This comparison measures the indicator’s values over multiple time periods.<br>The Mann-Kendall Test for Statistical Significance is used to evaluate the trend<br>over 4 to 10 periods of measure, subject to data availability and comparability.
County: Lake 3rd Grade Students Proficient in Math
County: Lake 3rd Grade Students Proficient in Math
25%
(2022)
Compared to:
CA Counties
The distribution is based on data from 57 California counties.
CA Value
(44%)
The regional value is compared to the California state value.
Prior Value
(23%)
Prior Value compares a measured value with the previously measured value. Confidence intervals were not taken into account in determining the direction of the comparison.
Trend
This comparison measures the indicator’s values over multiple time periods.<br>The Mann-Kendall Test for Statistical Significance is used to evaluate the trend<br>over 4 to 10 periods of measure, subject to data availability and comparability.
20%
(2022)
Compared to:
CA Counties
The distribution is based on data from 57 California counties.
CA Value
(44%)
The regional value is compared to the California state value.
Prior Value
(24%)
Prior Value compares a measured value with the previously measured value. Confidence intervals were not taken into account in determining the direction of the comparison.
Trend
This comparison measures the indicator’s values over multiple time periods.<br>The Mann-Kendall Test for Statistical Significance is used to evaluate the trend<br>over 4 to 10 periods of measure, subject to data availability and comparability.
County: Lake 4th Grade Students Proficient in Math
County: Lake 4th Grade Students Proficient in Math
18%
(2022)
Compared to:
CA Counties
The distribution is based on data from 57 California counties.
CA Value
(38%)
The regional value is compared to the California state value.
Prior Value
(20%)
Prior Value compares a measured value with the previously measured value. Confidence intervals were not taken into account in determining the direction of the comparison.
Trend
This comparison measures the indicator’s values over multiple time periods.<br>The Mann-Kendall Test for Statistical Significance is used to evaluate the trend<br>over 4 to 10 periods of measure, subject to data availability and comparability.
25.3%
(2022)
Compared to:
CA Counties
The distribution is based on data from 57 California counties.
CA Value
(47.1%)
The regional value is compared to the California state value.
Prior Value
(33.5%)
Prior Value compares a measured value with the previously measured value. Confidence intervals were not taken into account in determining the direction of the comparison.
Trend
This comparison measures the indicator’s values over multiple time periods.<br>The Mann-Kendall Test for Statistical Significance is used to evaluate the trend<br>over 4 to 10 periods of measure, subject to data availability and comparability.
County: Lake 5th Grade Students Proficient in Math
County: Lake 5th Grade Students Proficient in Math
10.7%
(2022)
Compared to:
CA Counties
The distribution is based on data from 57 California counties.
CA Value
(31.6%)
The regional value is compared to the California state value.
Prior Value
(10.4%)
Prior Value compares a measured value with the previously measured value. Confidence intervals were not taken into account in determining the direction of the comparison.
Trend
This comparison measures the indicator’s values over multiple time periods.<br>The Mann-Kendall Test for Statistical Significance is used to evaluate the trend<br>over 4 to 10 periods of measure, subject to data availability and comparability.
25.1%
(2022)
Compared to:
CA Counties
The distribution is based on data from 57 California counties.
CA Value
(45.1%)
The regional value is compared to the California state value.
Prior Value
(26.0%)
Prior Value compares a measured value with the previously measured value. Confidence intervals were not taken into account in determining the direction of the comparison.
Trend
This comparison measures the indicator’s values over multiple time periods.<br>The Mann-Kendall Test for Statistical Significance is used to evaluate the trend<br>over 4 to 10 periods of measure, subject to data availability and comparability.
County: Lake 6th Grade Students Proficient in Math
County: Lake 6th Grade Students Proficient in Math
12.6%
(2022)
Compared to:
CA Counties
The distribution is based on data from 57 California counties.
CA Value
(32.5%)
The regional value is compared to the California state value.
Prior Value
(12.9%)
Prior Value compares a measured value with the previously measured value. Confidence intervals were not taken into account in determining the direction of the comparison.
Trend
This comparison measures the indicator’s values over multiple time periods.<br>The Mann-Kendall Test for Statistical Significance is used to evaluate the trend<br>over 4 to 10 periods of measure, subject to data availability and comparability.
30.6%
(2022)
Compared to:
CA Counties
The distribution is based on data from 57 California counties.
CA Value
(49.2%)
The regional value is compared to the California state value.
Prior Value
(30.1%)
Prior Value compares a measured value with the previously measured value. Confidence intervals were not taken into account in determining the direction of the comparison.
Trend
This comparison measures the indicator’s values over multiple time periods.<br>The Mann-Kendall Test for Statistical Significance is used to evaluate the trend<br>over 4 to 10 periods of measure, subject to data availability and comparability.
County: Lake 7th Grade Students Proficient in Math
County: Lake 7th Grade Students Proficient in Math
14.2%
(2022)
Compared to:
CA Counties
The distribution is based on data from 57 California counties.
CA Value
(32.0%)
The regional value is compared to the California state value.
Prior Value
(14.3%)
Prior Value compares a measured value with the previously measured value. Confidence intervals were not taken into account in determining the direction of the comparison.
Trend
This comparison measures the indicator’s values over multiple time periods.<br>The Mann-Kendall Test for Statistical Significance is used to evaluate the trend<br>over 4 to 10 periods of measure, subject to data availability and comparability.
21.3%
(2022)
Compared to:
CA Counties
The distribution is based on data from 57 California counties.
CA Value
(46.6%)
The regional value is compared to the California state value.
Prior Value
(27.7%)
Prior Value compares a measured value with the previously measured value. Confidence intervals were not taken into account in determining the direction of the comparison.
Trend
This comparison measures the indicator’s values over multiple time periods.<br>The Mann-Kendall Test for Statistical Significance is used to evaluate the trend<br>over 4 to 10 periods of measure, subject to data availability and comparability.
County: Lake 8th Grade Students Proficient in Math
County: Lake 8th Grade Students Proficient in Math
7.2%
(2022)
Compared to:
CA Counties
The distribution is based on data from 57 California counties.
CA Value
(29.2%)
The regional value is compared to the California state value.
Prior Value
(12.3%)
Prior Value compares a measured value with the previously measured value. Confidence intervals were not taken into account in determining the direction of the comparison.
Trend
This comparison measures the indicator’s values over multiple time periods.<br>The Mann-Kendall Test for Statistical Significance is used to evaluate the trend<br>over 4 to 10 periods of measure, subject to data availability and comparability.
County: Lake High School Graduation
County: Lake High School Graduation
81.8%
(2022-2023)
Compared to:
CA Counties
The distribution is based on data from 57 California counties.
CA Value
(86.2%)
The regional value is compared to the California state value.
US Value
(86.5% in 2020)
The regional value is compared to the national value. The source for the national value is National Center for Education Statistics
Prior Value
(82.9%)
Prior Value compares a measured value with the previously measured value. Confidence intervals were not taken into account in determining the direction of the comparison.
Trend
This comparison measures the indicator’s values over multiple time periods.<br>The Mann-Kendall Test for Statistical Significance is used to evaluate the trend<br>over 4 to 10 periods of measure, subject to data availability and comparability.
HP 2030 Target
(90.7%)
